
THE NUMBERS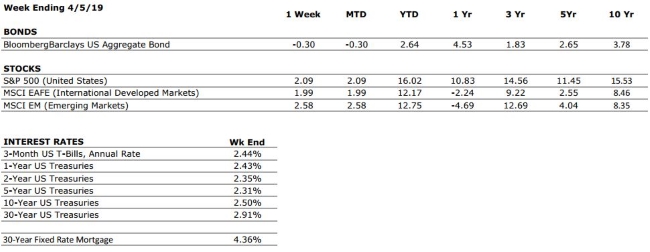
Sources: Index Returns: Morningstar Workstation. Past performance is no guarantee of future results. Indices are unmanaged and cannot be invested into directly. Three, five and ten year returns are annualized excluding dividends. Interest Rates: Federal Reserve, Freddie Mac
US ECONOMIC HEAT MAP
The health of the US economy is a key driver of long-term returns in the stock market. Below, we grade 5 key economic conditions that we believe are of particular importance to investors.
|
CONSUMER SPENDING |
A |
Our consumer spending grade remains an A. Surveys of US consumers continue to indicate that the consumer is in a strong position, and a recent bounceback in existing home sales suggests that households are still willing to make large purchases, which bodes well for the economy and for markets. |
|
FED POLICIES |
C+ |
(Upgraded from C-) Following its March meeting, the Federal Reserve signaled to markets that it may not hike interest rates during 2019, and plans to halt its balance sheet reductions. The Fed’s future actions will remain data dependent, but the contractionary policies that have dominated the last two years appear to be on pause. |
|
BUSINESS PROFITABILITY |
B- |
(Downgraded from B+) Corporate earnings remain strong, but we anticipate earnings growth will taper off in 2019. According toFacset, the expected earnings growth rate for S&P 500 companies during 2019 is around 4%. This is below the long-term average for the current cycle. |
|
EMPLOYMENT |
A |
The US economy added 196,000 new jobs in March, helping to alleviate concerns from an unexpectedly weak February report. Encouragingly, we have also observed some healthy wage growth, which is currently above the rate of inflation. |
|
INFLATION |
B |
Inflation is often a sign of “tightening” in the economy, and can be a signal that growth is peaking. The inflation rate remains benign at this time, but we see the potential for an increase moving forward. This metric deserves our attention. |
|
OTHER CONCERNS |
||
|
INTERNATIONAL RISKS |
5 |
The above ratings assume no international crisis. On a scale of 1 to 10 with 10 being the highest level of crisis, we rate these international risks collectively as a 5. These risks deserve our ongoing attention. |
The “Heat Map” is a subjective analysis based upon metrics that VNFA’s investment committee believes are important to financial markets and the economy. The “Heat Map” is designed for informational purposes only and is not intended for use as a basis for investment decisions.