
 THE NUMBERS
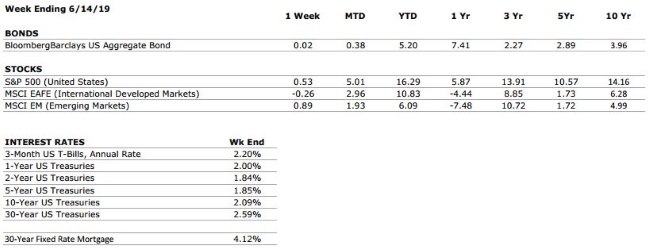
Sources: Index Returns: Morningstar Workstation. Past performance is no guarantee of future results. Indices are unmanaged and cannot be invested into directly. Three, five and ten year returns are annualized excluding dividends. Interest Rates: Federal Reserve, Freddie Mac
US ECONOMIC HEAT MAP
The health of the US economy is a key driver of long-term returns in the stock market. Below, we grade 5 key economic conditions that we believe are of particular importance to investors.
|
CONSUMER SPENDING |
A |
Our consumer spending grade remains an A. Surveys of US consumers continue to indicate that the consumer is in a strong position. |
|
FED POLICIES |
C+ |
Following its March meeting, the Federal Reserve signaled to markets that it may not hike interest rates during 2019, and plans to halt its balance sheet reductions. The Fed’s future actions will remain data dependent, but the contractionary policies that have dominated the last two years appear to be on pause. |
|
BUSINESS PROFITABILITY |
B- |
As was anticipated, first quarter earnings revealed a tapering of growth. According to Facset, the blended earnings decline for Q1 2019 is -0.4% (with 98% of S&P 500 companies having reported). However, more than 75% of these companies have reported earnings that were higher than consensus estimates. |
|
EMPLOYMENT |
A |
The US economy added just 75,000 new jobs in May, well below the consensus estimates as well as recent trends. However, monthly jobs data tends to be volatile, and it is certainly possible that there is a significant rebound in June (as there was between February and March). We continue to view the jobs market as very healthy. |
|
INFLATION |
B |
Inflation is often a sign of “tightening” in the economy, and can be a signal that growth is peaking. The inflation rate remains benign at this time, but as the economic cycle continues to mature, this metric will deserve our ongoing attention. |
|
OTHER CONCERNS |
||
|
INTERNATIONAL RISKS |
7 |
We have raised our international risks rating to a 7 as a result of rising tensions between the US and Iran, as well as the recent decision by the Trump administration to impose a sales ban on Chinese tech company Huawei. The ban is representative of the risks associated with the growing technology rivalry between the US and China. |
The “Heat Map” is a subjective analysis based upon metrics that VNFA’s investment committee believes are important to financial markets and the economy. The “Heat Map” is designed for informational purposes only and is not intended for use as a basis for investment decisions.