
THE NUMBERS
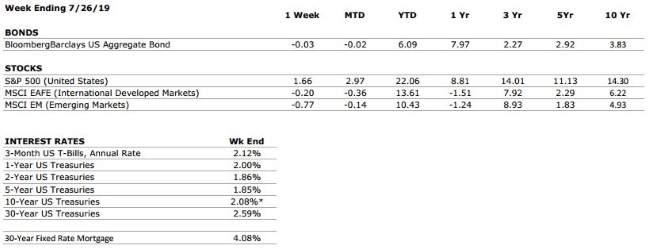 Sources: Index Returns: Morningstar Workstation. Past performance is no guarantee of future results. Indices are unmanaged and cannot be invested into directly. Three, five and ten year returns are annualized excluding dividends. Interest Rates: Federal Reserve, Freddie Mac
US ECONOMIC HEAT MAP
The health of the US economy is a key driver of long-term returns in the stock market. Below, we grade 5 key economic conditions that we believe are of particular importance to investors.
|
CONSUMER SPENDING |
A |
Our consumer spending grade remains an A. Surveys of US consumers continue to indicate that the consumer is in a strong position, and last week’s GDP provided further evidence of healthy consumer spending. |
|
FED POLICIES |
B+ |
We have increased our Fed Policies grade to a B+ after Jerome Powell commented that “a number” of Fed decision makers believe that the case for a rate cut in the near future has strengthened. Markets are expecting a rate cut this week. |
|
BUSINESS PROFITABILITY |
B- |
As was anticipated, first quarter earnings revealed a tapering of growth. Expectations for Q2 earnings are also relatively low. However, this is largely a result of the fact that YoY comparisons are made relative to a historically strong 2018. |
|
EMPLOYMENT |
A |
The US economy added 224,000 new jobs in June, beating consensus estimates by a wide margin. We continue to view the jobs market as very healthy. |
|
INFLATION |
B |
Inflation is often a sign of “tightening” in the economy, and can be a signal that growth is peaking. The inflation rate remains benign at this time, but as the economic cycle continues to mature, this metric will deserve our ongoing attention. |
|
OTHER CONCERNS |
||
|
INTERNATIONAL RISKS |
6 |
We have adjusted our international risks rating down one notch to a 6 following a recent cooling of rhetoric in the US/China trade negotiations. While new developments are still likely to create short-term volatility in markets, both sides have an incentive to reach a deal. |
The “Heat Map” is a subjective analysis based upon metrics that VNFA’s investment committee believes are important to financial markets and the economy. The “Heat Map” is designed for informational purposes only and is not intended for use as a basis for investment decisions.