Q3 Estimated tax
payments are due September 16, 2019!
These estimates may
include federal, state and/or local vouchers depending on your situation.
Daily Archives: September 3, 2019
The Numbers & “Heat Map”
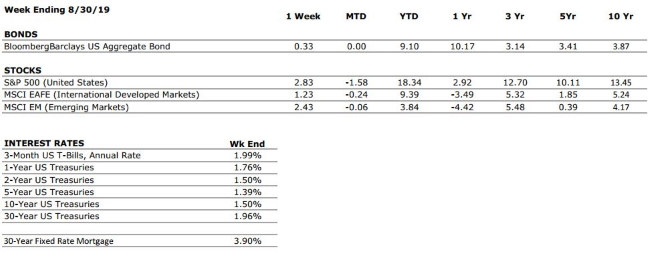
THE NUMBERS
 Sources: Index Returns: Morningstar Workstation. Past performance is no guarantee of future results. Indices are unmanaged and cannot be invested into directly. Three, five and ten year returns are annualized excluding dividends. Interest Rates: Federal Reserve, Freddie Mac
U.S. ECONOMIC HEAT MAP
The health of the U.S. economy is a key driver of long-term returns in the stock market. Below, we grade 5 key economic conditions that we believe are of particular importance to investors.
|
CONSUMER SPENDING |
A |
Our consumer spending grade remains an A. Surveys of US consumers continue to indicate that the consumer is in a strong position, and recent GDP data provided further evidence of healthy consumer spending. |
|
FED POLICIES |
B+ |
Our Fed Policies grade remains a B+ after the Federal Reserve opted to cut its interest rate target by 25 bps following last month’s meeting. The cut was widely anticipated by markets, and if history is any representation, it is unlikely to be the last. |
|
BUSINESS PROFITABILITY |
B- |
With most S&P 500 companies having reported Q2 earnings, the EPS growth rate for the second quarter is close to zero. Despite the weak growth rate, almost 75% of companies have beaten consensus estimates this quarter. |
|
EMPLOYMENT |
A |
The US economy added 164,000 new jobs in July, right on target with consensus expectations. July’s report also showed that the size of the labor force (defined as those who are either working or actively seeking employment) grew to its highest level ever. The labor market remains one of the strongest components of the US economy. |
|
INFLATION |
A |
Inflation is often a sign of “tightening” in the economy, and can be a signal that growth is peaking. Despite a tight labor market, we continue to see no signs of an increase in inflation. This bodes well for the extension of the economic cycle. |
|
OTHER CONCERNS |
||
|
INTERNATIONAL RISKS |
7 |
Following a re-escalation of the US/China trade dispute, we have raised our “international risks” metric back to a 7. Other key areas of focus for markets include the ongoing Brexit negotiations, rising economic nationalism around the globe, and escalating tensions in the Middle East. |
The “Heat Map” is a subjective analysis based upon metrics that VNFA’s investment committee believes are important to financial markets and the economy. The “Heat Map” is designed for informational purposes only and is not intended for use as a basis for investment decisions.
Quote of the Week
“People say that money isn’t the key to happiness, but I always figured if you have enough money, you can have a key made.”– Joan Rivers
The Markets This Week
by Connor Darrell CFA, Assistant Vice President – Head of Investments
Equity markets broke a four-week streak of losses last week, pushed higher by a cooling of trade rhetoric coming out of both the U.S. and China. Both sides confirmed that trade talks remain scheduled for September, and comments from the Chinese Ministry of Commerce suggested that China would not immediately retaliate against the most recent U.S. tariff increase. Bonds generated another week of positive returns as interest rates continued to slide lower. Bond yields have been trending downward for the entirety of 2019 as a result of softening global economic data and negative yielding rates in much of the developed world. The lack of positive yield available overseas has created a surplus of demand for U.S. treasuries and led to a significant increase in prices.
Despite some of the “warning” signals that have flashed in the bond market over the past several weeks, there remains reason for investors to be cautiously optimistic. The U.S. consumer remains very healthy at this point in time and looks poised to continue carrying the economy forward. Additionally, second quarter corporate earnings came in stronger than expected, with corporate margins holding up particularly well despite the wage pressures created by a tight labor market. All of this bodes well for the resiliency of the U.S. economy, and we continue to recommend that investors remain disciplined in the wake of increased volatility.
“Your Financial Choices”
The show airs on WDIY Wednesday evenings, from 6-7 p.m. The show is hosted by Valley National’s Laurie Siebert CPA, CFP®, AEP®.
This week, Laurie will discuss: “Labor – employment benefits, open enrollment, tax implications.”
Recordings of past shows are available to listen or download at both yourfinancialchoices.com and wdiy.org.
