
THE NUMBERS
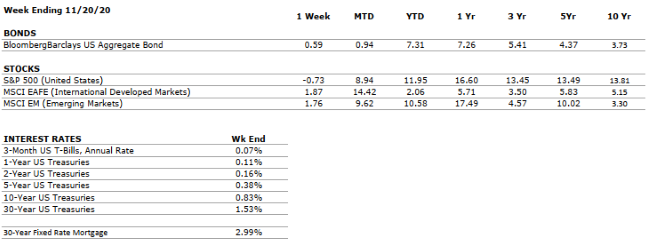
Sources: Index Returns: Morningstar Workstation. Past performance is no guarantee of future results. Indices are unmanaged and cannot be invested into directly. Three, five and ten year returns are annualized. Interest Rates: Federal Reserve, Mortgage Bankers Association.
MARKET HEAT MAP
The health of the economy is a key driver of long-term returns in the stock market. Below, we assess the key economic conditions that we believe are of particular importance to investors.
|
US ECONOMY |
||
|
CONSUMER HEALTH |
NEGATIVE |
GDP increased at a 33.1% annualized pace in Q3. The U.S. economy has now recovered about 2/3 of its output lost to the COVID-19 pandemic. |
|
CORPORATE EARNINGS |
NEGATIVE |
As more than 90% of S&P 500 constituents have reported Q3 results, the index’s earnings are down 7-8% from the year-ago period. This compares to Q2 2020, in which S&P 500 earnings were down by 1/3 from the comparable 2019 quarter. |
|
EMPLOYMENT |
NEGATIVE |
As of October’s end, the U.S. unemployment rate stood at 6.9%, well below where most expected the metric to be at this point some months ago. The unemployment rate has consistently declined since peaking above 14% in April. |
|
INFLATION |
POSITIVE |
The Fed plans to allow inflation to temporarily overshoot its 2% target such that the long-term average is 2%. Inflation has been tame since the Great Financial Crisis, less than 2%. |
|
FISCAL POLICY |
VERY POSITIVE |
A second major COVID-19 stimulus bill is likely to be passed over the coming months. |
|
MONETARY POLICY |
VERY POSITIVE |
The Federal Reserve has supported asset markets with unprecedented speed and magnitude in response to COVID-19. |
|
GLOBAL CONSIDERATIONS |
||
|
GEOPOLITICAL RISKS |
VERY NEGATIVE |
The relationship between the US and China, the world’s two largest economies, was already weakened by the trade war but has deteriorated further as a result of COVID-19. |
|
ECONOMIC RISKS |
VERY NEGATIVE |
The impacts from COVID-19 were as swift and pronounced as any shock in modern times. Robust monetary and fiscal stimulus stabilized the system; however, economic activity remains well- below that in 2019, and uncertainty remains high. |
The “Heat Map” is a subjective analysis based upon metrics that VNFA’s investment committee believes are important to financial markets and the economy. The “Heat Map” is designed for informational purposes only and is not intended for use as a basis for investment decisions.