
April 15th is less than two months away!
Our Tax Departments is ready to file your return. Send us your documents and complete our Tax Questionnaire.
valleynationalgroup.com/tax
Monthly Archives: February 2021
Current Market Observations
by William
Henderson, Vice President / Head of Investments
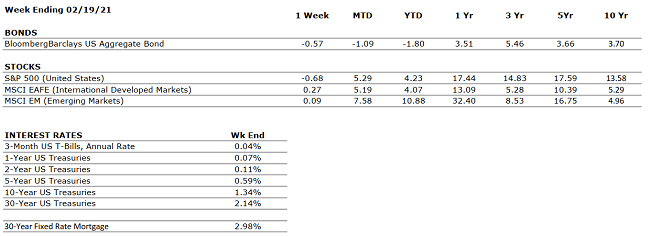
For the week that ended February 19, 2021, the Dow Jones Industrial Average returned a nominal +0.2%, barely positive while the two broader indices were both negative for the week with the S&P 500 Index falling –0.3% and the NASDAQ –1.1%. With last week’s mixed results, returns nonetheless remained positive on a year-to-date basis. Year-to-date,
the Dow Jones Industrial Average has returned +3.2%, the S&P 500 Index +4.2% and the NASDAQ +7.8%. For the week, the 10-year U.S. Treasury note moved significantly higher by 13 basis points to a post-pandemic 1.29%.
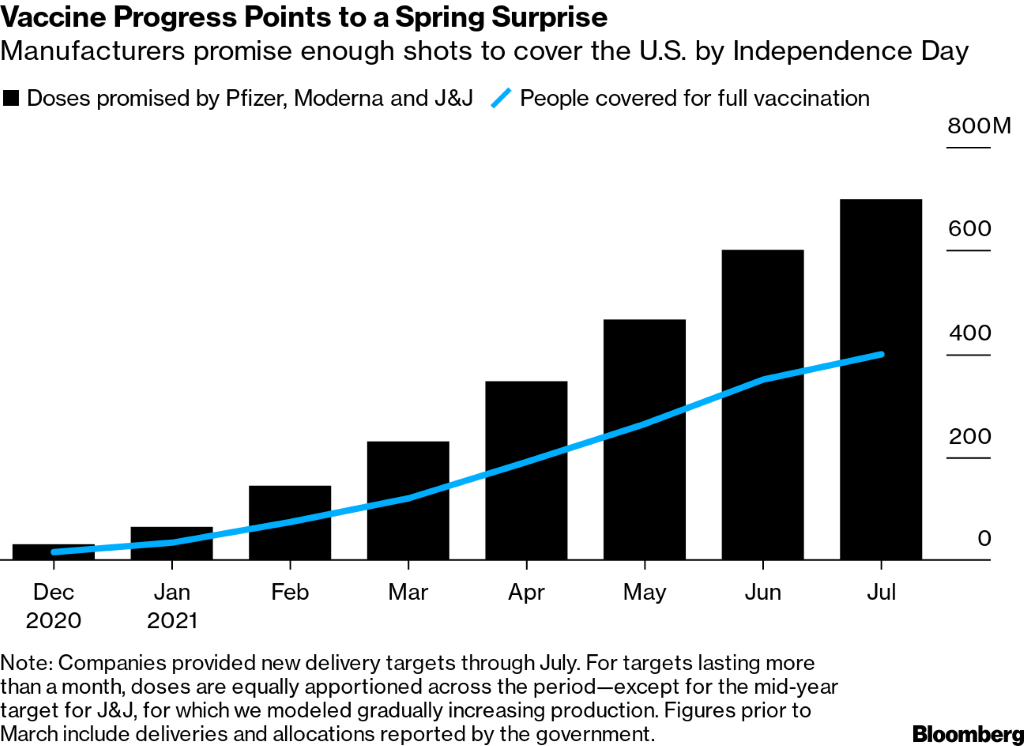
No one can question, that the economy still is not “normal,” but the markets sure are acting that way. Year-to-date returns, noted above, are decent and certainly point to a positive year overall. Further, last week’s economic releases around industrial production, housing and retails sales were strong. Everything seems to be COVID-19 related. According to Johns Hopkins University, fresh COVID-19 cases for the week ending Feb. 14 were the lowest since October, at 2.7 million, a modest 2.5% increase in total infections from the previous week, the weakest gain since the start of the pandemic and less than half the rate seen a month earlier. Lastly, corporate profits (EPS) announcements continue to beat expectations, credit spreads are narrowing and capital expenditures by corporations are increasing. Soon, we are going to see rebounds in the sectors that were most battered by the virus-related economic shutdown.
Even as Treasury Secretary Yellen calms warnings about inflation, investors are fleeing bonds amid fears that inflation with heat up and return. The rise in the 10-year Treasury to 1.29% last week certainly shows investors are worried about bonds. Yields move opposite direction to prices and rising bond yields can hurt investors. The bigger story here is not bonds but instead the stock market which has multiple tailwinds supporting further positive movements. President Biden’s stimulus package, whether it is $1.4 or $1.9 trillion is going to be huge. Treasury Secretary Yellen and Fed Chair Powell are going to be patient around inflation moves and fully supportive of the administration’s efforts with fiscal stimulus. As mentioned, COVID-19 cases are down, the vaccine is being widely distributed and national herd immunity is expected by mid-summer or sooner.
Things may not be “normal,” but normal is closer than we think. A common misstep all investors should avoid is trying to time the market, and 2020 showed just how detrimental timing the market could be for investors even in the short term. Stay focused on the long-term objective and realize “normal” is coming back.
The Numbers & “Heat Map”
THE NUMBERS
 Sources: Index Returns: Morningstar Workstation. Past performance is no guarantee of future results. Indices are unmanaged and cannot be invested into directly. Three, five and ten year returns are annualized. Interest Rates: Federal Reserve, Mortgage Bankers Association.
MARKET HEAT MAP
The health of the economy is a key driver of long-term returns in the stock market. Below, we assess the key economic conditions that we believe are of particular importance to investors.
|
US ECONOMY |
||
|
CONSUMER HEALTH |
NEUTRAL |
Retail sales increased by over 5% in January, far higher than the 1% economist expectations. January was also the first month since October in which retail sales were positive month-over- month. |
|
CORPORATE EARNINGS |
POSITIVE |
With >80% of S&P 500 constituents having reported Q4 earnings, profit growth is coming in at >3% year-over-year, well more than analyst expectations, which figured that earnings would fall by 7%. Earnings in 2021 are set to look strong as they lap Q2-Q3 2020. |
|
EMPLOYMENT |
NEGATIVE |
The unemployment rate declined to 6.3% in January from 6.7% in December. Labor weakness remains in sectors such as Leisure and Travel; such sectors stand to benefit as vaccine distribution accelerates. |
|
INFLATION |
POSITIVE |
The Fed plans to allow inflation to temporarily overshoot its 2% target such that the long-term average is 2%. Inflation has been tame since the Great Financial Crisis, less than 2%. |
|
FISCAL POLICY |
POSITIVE |
Discussions on President Biden’s a $1.9 trillion stimulus package are ongoing. If the bill passes through Congress, the U.S. economy will have received a total of approximately $4 trillion in stimulus over the trailing twelve months. |
|
MONETARY POLICY |
VERY POSITIVE |
The Federal Reserve continues to indicate that the monetary environment will remain very accommodative for the foreseeable future. |
|
GLOBAL CONSIDERATIONS |
||
|
GEOPOLITICAL RISKS |
NEUTRAL |
There are few, if any, looming geopolitical risks that could upset the economic recovery. |
|
ECONOMIC RISKS |
NEUTRAL |
Although economic activity mostly remains below 2019’s levels, improvement has occurred across nearly every measure since the April 2020 nadir. With multiple vaccines in distribution, a second fiscal package in place, and interest rates low, 2021 is positioning to be a strong economic year. |
The “Heat Map” is a subjective analysis based upon metrics that VNFA’s investment committee believes are important to financial markets and the economy. The “Heat Map” is designed for informational purposes only and is not intended for use as a basis for investment decisions.
Quote of the Week
“Hope is like a road in the country; there was never a road, but when many people walk on it, the road comes into existence.” – Lin Yutang
“Your Financial Choices”
Tune in Wednesday, 6 PM
for “Your Financial Choices” show on WDIY 88.1FM: Deciphering
Tax Documents
Laurie can take your questions live on the air at 610-758-8810, or address
those submitted via yourfinancialchoices.com.
Recordings of past shows are available to listen or download at both yourfinancialchoices.com and wdiy.org.
VNFA NEWS

Welcome Luis Sepulveda to Team VNFA!
Luis will be working remotely from the Bethlehem office as Financial Technology & Trading Associate. He joins the team with more than 15 years of trading and operations experience. In his new role, Luis will manage investment databases and assist with operational support as part of the VNFA Investment Department. Luis has a B.S. in Business Administration, Finance from Villanova University.
VNFA Team Chat (February 2021)
VNFA Team Chat – Trending Topics (February 2021)
Financial Advisors Joseph Goldfeder, CFP® and Rod Young, CPA/PFS, CFP® discuss 83B tax election options and ESG investing.
Current Market Observations
by William Henderson, Vice President / Head of Investments
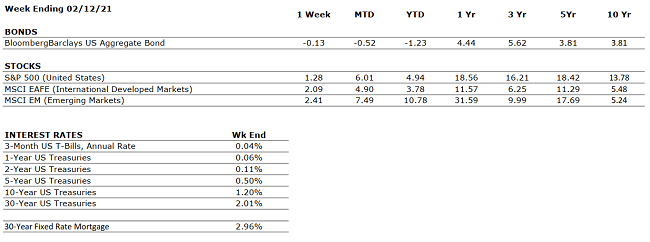
The markets continued to move into record high territory last week looking past COVID-19 and forward to additional stimulus, greater distribution of vaccines and a long-awaited recovery in employment. As expected, Fed Chair Jerome Powell also stuck with his dovish tone last week reminding us that the Fed has no intention of lifting from the economic accelerator for a long time. For the week ended February12, 2021, the Dow Jones Industrial Average returned +1.0%, the S&P 500 Index +1.2% and the NASDAQ +1.7%. Last week’s returns piled onto an already positive year for the markets. Year-to-date, the Dow Jones Industrial Average has returned +3.0%, the S&P 500 Index +4.9% and the NASDAQ at +9.4%. For the week, the 10-year U.S. Treasury note moved only one basis point higher to 1.16%.
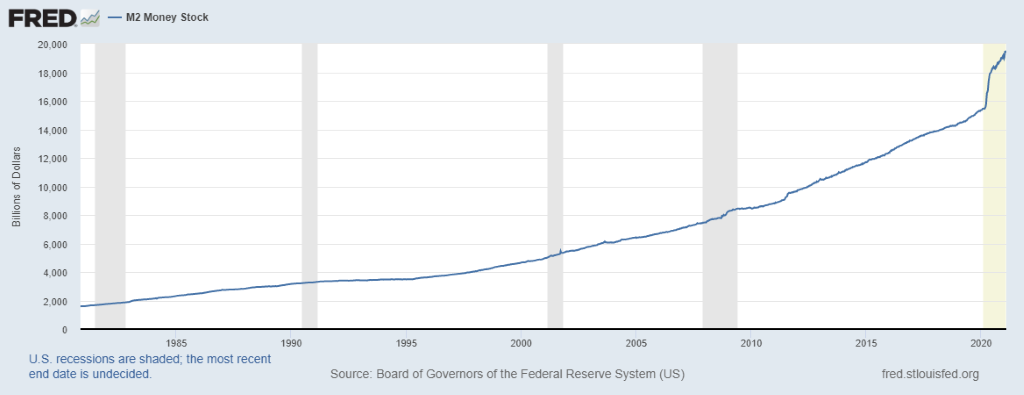
We have talked about M2, the Money Stock of savings deposits, bank deposits and retail money market fund balances, several times in The Weekly Commentary. The chart above from the Federal Reserve Bank of St. Louis shows M2 sitting at record levels and indicates graphically how much cash is sitting on the sidelines waiting to be released into a post-COVID-19 economy. An additional stimulus package of $1.5 to $1.9 trillion will only add to those reserves. As we reach herd immunity and the magic 75% of the population vaccinated, that cash will be put to work. Sectors like leisure, travel, energy, and retail will see a surge in activity. It will be gradual and the journey back to normal will be bumpy and winding, but it is in sight and the markets are seeing the end game not the path.
I feel like this column often returns to the same thing: a dovish Fed, a willing Treasury Secretary, an able Democratic majority party across the government, and vaccine distribution when coupled with the sidelined cash only points to a very healthy economy in the second half of 2021. Several firms are predicting double-digit GDP prints (10%-11%) in 3Q & 4Q 2021. Investors should look past the clamor, and instead focus on the end game described above. It is interesting to note that on years when the S&P 500 Index returns greater than 10%, there are between three and five market corrections that year of 5% or more. Why does that matter? It is a reminder to investors that corrections are normal in healthy markets and part of long-term investing.
The Numbers & “Heat Map”
THE NUMBERS
 Sources: Index Returns: Morningstar Workstation. Past performance is no guarantee of future results. Indices are unmanaged and cannot be invested into directly. Three, five and ten year returns are annualized. Interest Rates: Federal Reserve, Mortgage Bankers Association.
MARKET HEAT MAP
The health of the economy is a key driver of long-term returns in the stock market. Below, we assess the key economic conditions that we believe are of particular importance to investors.
|
US ECONOMY |
||
|
CONSUMER HEALTH |
NEUTRAL |
U.S. GDP increased at a 4% annualized rate in Q4. For the full-year 2020, the U.S. economy contracted by 3.5%, its worst performance since 1946. GDP is expected to improve meaningfully in 2021 as the American population gets vaccinated. |
|
CORPORATE EARNINGS |
NEUTRAL |
With 3/4 of S&P 500 constituents having reported Q4 earnings, profit growth is coming in at 2.8% year-over-year, well in excess of analyst expectations, which figured that earnings would fall by 7%. |
|
EMPLOYMENT |
NEGATIVE |
The unemployment rate declined to 6.3% in January from 6.7% in December. Labor weakness remains in sectors such as Leisure and Travel; such sectors stand to benefit as vaccine distribution accelerates. |
|
INFLATION |
POSITIVE |
The Fed plans to allow inflation to temporarily overshoot its 2% target such that the long-term average is 2%. Inflation has been tame since the Great Financial Crisis, less than 2%. |
|
FISCAL POLICY |
POSITIVE |
Discussions on President Biden’s a $1.9 trillion stimulus package are ongoing. If the bill passes through Congress, the U.S. economy will have received a total of approximately $4 trillion in stimulus over the trailing 12 months. |
|
MONETARY POLICY |
VERY POSITIVE |
The Federal Reserve continues to indicate that the monetary environment will remain very accomodative for the foreseeable future. |
|
GLOBAL CONSIDERATIONS |
||
|
GEOPOLITICAL RISKS |
NEUTRAL |
There are few, if any, looming geopolitical risks that could upset the economic recovery. |
|
ECONOMIC RISKS |
NEUTRAL |
Although economic activity mostly remains below 2019’s levels, improvement has occurred across nearly every measure since the April 2020 nadir. With multiple vaccines in distribution, a second fiscal package in place, and interest rates low, 2021 is positioning to be a strong economic year. |
The “Heat Map” is a subjective analysis based upon metrics that VNFA’s investment committee believes are important to financial markets and the economy. The “Heat Map” is designed for informational purposes only and is not intended for use as a basis for investment decisions.
Quote of the Week
“Some days there won’t be a song in your heart. Sing anyway.” – Emory Austin