Team
VNFA is officially partnered with Big Brothers Big Sisters of the Lehigh Valley
for the 2021 Volunteer Challenge. For our skills-based, virtual project will
create a collection of workplace readiness videos for BBBSLV’s Beyond School
Walls program. Meet our partner and follow our journey to the May 20 Challenge!
Team Chat (March 2021) – Responsible Investing Head of Investments, Bill Henderson, and CEO, Matt Petrozelli, discuss “responsible investing” and current market trends.WATCH NOW
by William Henderson, Vice
President / Head of Investments
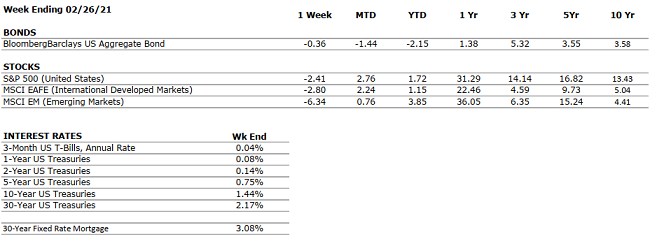
Markets ended mixed last week with the broader indices posting
slight gains while the tech-heavy NASDAQ posted a loss. For the week that ended
March 5, 2021, the Dow Jones Industrial Average returned +1.8% and the S&P 500 Index gained +0.8%, while the NASDAQ fell by -2.1%. Year-to-date, each index remains just in positive territory. Year-to-date, the Dow Jones Industrial Average has returned +3.3%, the S&P 500 Index +2.6% and the NASDAQ +0.4%. These returns are indicative of a strong recovery as growth stocks,
which are best represented by the NASDAQ, initially lead the market out of a recession; and value stocks, represented more
closely by the Dow Jones Industrial Average, tend to accelerate once the
recovery is well under way.
Treasury bond
yields continued to rise last week as the 10-year U.S. Treasury Note moved higher in
yield by six basis points to 1.60%. Improving economic data and the imminent passing of the $1.9 trillion
stimulus program both contributed to the sell-off in Treasuries. Last week saw a sharp reversal of equities on Friday as the US Bureau of Labor Statistics released a strong jobs number on Thursday. The domestic economy added 379,000 jobs in February, exceeding Bloomberg-surveyed economists’ forecasts
for a 200,000 gain. The strong rebound in jobs, even before the economy fully reopens, is showing the full depth and breadth of the economy’s V-recovery. Further, Cornerstone Macro’s economist is predicting job gains in 2021 to average 500k
per month and for Real GDP to approach 8-10% this year.
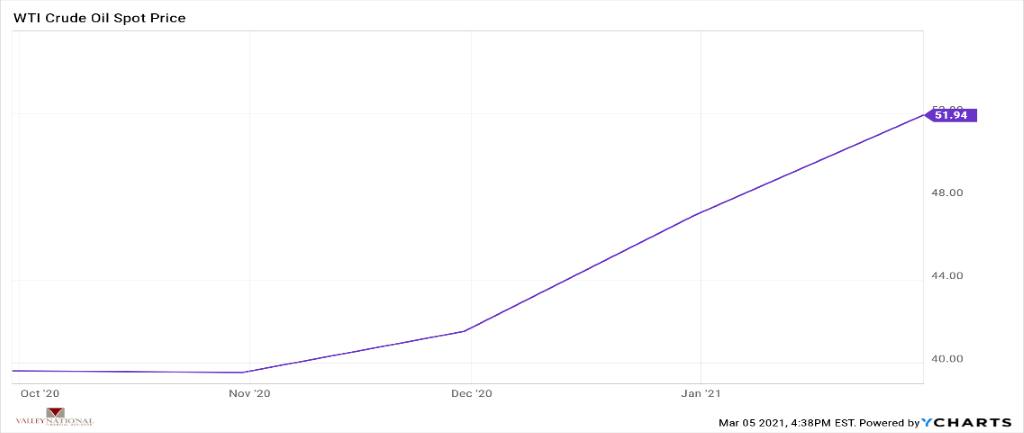
Inflations remains benign even in the face of higher oil prices. The spot price of WTI (West Texas Intermediate Crude) reached $52/barrel last week, a six-month high. This is what happens when you turn off or shrink
the U.S. oil production spigot (think Keystone XL Pipeline, fracking and limited further drilling on federal lands.)
Conversely, solar
and wind projects continue to set a rapid pace as the U.S. Energy market slowly
but deliberately converts to renewable sources of energy from fossil fuels. Cornerstone Macro
expects combined energy output from wind and solar to move from 12% in 2020 to 30% in 2030.
It is important to
remember that a strong economy is always more important than oil prices and the
fear of rising interest rates. Fed policy of near zero on short-term rates coupled with continued fiscal stimulus assistance are aiding the strong economic recovery we are seeing in 2021. The
strong jobs number we saw last week is just the beginning. As the COVID-19 vaccination reaches more and more people,
the travel and leisure sector of the economy is expected to bounce back as consumers are finally offered the opportunity to spend their squirreled
away savings.
THE NUMBERS Sources: Index Returns: Morningstar Workstation. Past performance is no guarantee of future results. Indices are unmanaged and cannot be invested into directly. Three, five and ten year returns are annualized. Interest Rates: Federal Reserve, Mortgage Bankers Association.
MARKET HEAT MAP
The health of the economy is a key driver of long-term returns in the stock market. Below, we assess the key economic conditions that we believe are of particular importance to investors.
US ECONOMY
CONSUMER HEALTH
NEUTRAL
Retail sales increased by over 5% in January, far higher than the 1% economist expectations. January was also the first month since October in which retail sales were positive month-over- month.
CORPORATE EARNINGS
POSITIVE
S&P 500 Q4 profits grew 3.8% year-over-year, well in excess of analyst expectations, which figured that earnings would fall by 7%. Earnings in 2021 are set to look strong as they lap Q2-Q3 2020.
EMPLOYMENT
NEGATIVE
The unemployment rate declined to 6.2% in February from 6.4% in January. Most of the added jobs last month were concentrated in the Leisure & Travel sector. Total employment remains 9.5 million jobs below the pre-pandemic peak.
INFLATION
POSITIVE
The Fed plans to allow inflation to temporarily overshoot its 2% target such that the long-term average is 2%. Inflation has been tame since the Great Financial Crisis, less than 2%.
FISCAL POLICY
POSITIVE
President Biden’s $1.9 trillion stimulus package passed through the Senate over the weekend; the House will vote this week. If the bill passes fully through Congress, the U.S. economy will have received a total of approximately $4 trillion in stimulus during the COVID-19 pandemic.
MONETARY POLICY
VERY POSITIVE
The Federal Reserve continues to indicate that the monetary environment will remain very accommodative for the foreseeable future.
GLOBAL CONSIDERATIONS
GEOPOLITICAL RISKS
NEUTRAL
There are few, if any, looming geopolitical risks that could upset the economic recovery.
ECONOMIC RISKS
NEUTRAL
Although economic activity mostly remains below 2019’s levels, improvement has occurred across nearly every measure since the April 2020 nadir. With multiple vaccines in distribution, a second fiscal package in place, and interest rates low, 2021 is positioning to be a strong economic year.
The “Heat Map” is a subjective analysis based upon metrics that VNFA’s investment committee believes are important to financial markets and the economy. The “Heat Map” is designed for informational purposes only and is not intended for use as a basis for investment decisions.
Laurie can take your questions live on the air at 610-758-8810, or address
those submitted via yourfinancialchoices.com.
Recordings of past shows are available to listen or download at both yourfinancialchoices.com and wdiy.org.