We are pleased to
announce the promotion of Ildebrando Cruz to the new position of Trading &
Operations Manager. In addition to his ongoing work in trading and portfolio
management, Brando will now formally oversee processes, reporting and training
for internal operations.
Brando celebrated 14 years with the company this month. He began his work with VNFA as a Coordinator in 2007. In that time, he has made contributions to many parts of the business, including billing, account management, performance reporting, trading compliance, and specialty portfolios.
“Brando has always had a keen attention to detail and a commitment to excellence that is the hallmark of our VNFA brand,” said Matt Petrozelli, CEO. “As the firm continues to grow and evolve, Brando has maintained a sharp focus on accuracy, security and compliance while also creating and implementing innovative process improvements.”
Brando has been in the Investment field since 1989. His professional licenses include the series 7 and series 66. In addition to this work overseeing operations, Brando is also a member of VNFA’s internal Investment Committee. Prior to his tenure at VNFA, he was the “Service Manager” for the Private Banking Division of Bankers Trust Company working with high net worth individuals in the Custody, Trust and Investment Advisory divisions.
Outside of work, Brando is passionate about seeing the beauty of the
View/Download PDF version of Q1 Commentary (or read text below) Fixed Income Fixed income securities declined, in aggregate, during Q1 2021, as interest rates rose; bonds prices fall when rates increase. The 10-year treasury bond, the most widely referenced proxy for U.S. interest rates, has nearly doubled during the first three months of the year, from 0.95% to 1.65%. While the increase has been sharp and brisk, rates remain extremely low relative to historical standards. For perspective, in the near-decade leading up to the 2008 financial crisis, the 10-year government bond resided around 5%. Rates have remained structurally lower post-2009, but in the year or two pre-COVID, the 10-year was at 2-3%.
Low interest rates facilitate economic activity because they mean that it is cheap to borrow money. Borrowed money is used to finance businesses and personal expenditures, thereby buoying economic output. Moreover, fixed income represents the prime alternative to equities; low rates are less appealing than high rates, all else equal, to investors, and therefore, when rates are low, demand for – and therefore, the price of – equities tends to be elevated. The main risk to the low rate paradigm is inflation; should inflation materialize at a rate greater than that of current expectations, the Federal Reserve will likely hike rates. Higher rates curb inflation because it boosts the expected return on savings, thereby encouraging investors to park money away rather than spend it (and hasty spending is the driver of inflation). For now, inflation expectations remain moderate, around 2%; in turn, rates are likely to remain relatively low.
Equities The S&P 500, Dow Jones Industrial Average, and Nasdaq 100 were up approximately 6%, 9%, and 3%, respectively, in the first three months of 2021. The Dow’s leadership – and the Nasdaq’s lag – are a reversal from 2020, during which time the tech-heavy Nasdaq outperformed the industrial-laden Dow. Clearly, in 2020, tech stocks benefitted from “stay-at-home” trends; in 2021, however, travel and leisure are set to uncoil as the American population gets vaccinated.
As touched on above, stocks are benefitting from an accommodative interest rate environment in which investor demand for fixed income is muted owed to low rates. On top of this, the tremendous volume of fiscal stimulus combined with reopening trends imply a highly favorable 2021 outlook for U.S. corporations. Outlook As of mid-April, between 25-30% of the U.S. population has been vaccinated. The pace of inoculation is highly encouraging and suggests that sometime during the summer, a great enough portion of Americans will be vaccinated such that “normalcy” – or something resembling it – will resume. Reflecting the pent-up demand that will be truly unleashed, economists believe U.S. GDP could be as high as 6% during 2021, the most productive economic year in America since the 1980’s. While equity valuations appear high relative to historical figures, the stock market is not expensive compared to fixed income, the more salient measure. As fiscal stimulus flows through the economy and amplifies the pent-up demand, corporate earnings are likely to increase meaningfully and support current stock prices. As discussed, the key risk facing financial markets is inflation, because high inflation would likely force rates up, hindering equity valuations. At this point, though, we note that inflation expectations remain moderate and therefore, inflation is unlikely to interfere with the near-term outlook.
by William
Henderson, Vice President / Head of Investments
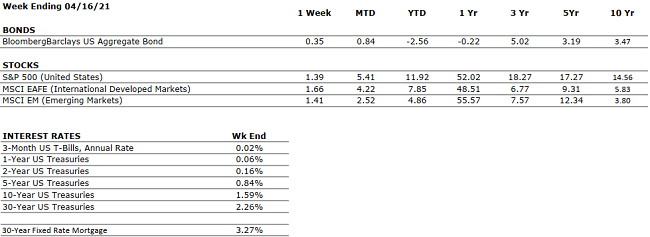
The market continued its
hot streak with yet another week of positive gains across all three major indices. For
the week that
ended April 16,
2021,
the Dow Jones Industrial Average returned +1.2%,
the S&P 500 Index gained +1.4%,
and the
NASDAQ moved higher
by +1.1%. Year-to-date
gains moved higher as well, with the
Dow Jones Industrial Average returning +12.3%,
the S&P 500 Index +11.9%
and the NASDAQ +9.2%. Strong
demand from international investors for U.S. Treasuries pushed bond yields
lower again even as the economy is exhibiting considerable evidence of a
powerful rebound in 2021. The 10-year U.S. Treasury Bond closed the week
at 1.58% down another eight basis points from the previous week.
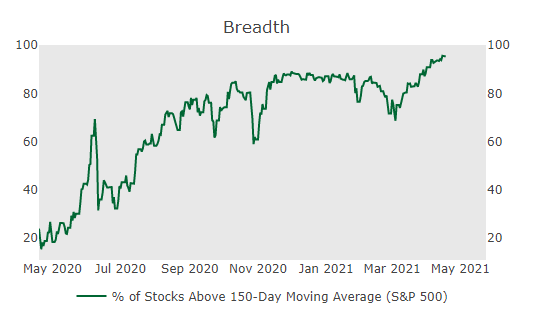
The past week’s gains were widespread with the market
showing strength and breadth of performance
across several industry sectors including healthcare, retail, and
industrial names. Widespread gains across industry sectors is a
sign that the market is healthy with strong participation by
many companies and industries rather than just a few names. See the chart
below from Cornerstone Macro showing
the Breadth of the Market
in terms of the percent
of stocks in the
S&P 500 above their
150-day moving average.
Evidence of the economic rebound was present
in several places last week. According
to Bloomberg, retails sales rose by 9.8% in
March compared with February; this was the one
of the largest paced gains in 30 years. The jump in sales was driven
by consumer spending as stimulus checks continued to hit personal bank
accounts. The more favorable news
was that easing of COVID-19 lockdown restrictions and
progress in vaccinations allowed consumers
to resume their old spending habits. Spending was spread among many retail sectors
such as clothing
stores, motor vehicle sales, and restaurant
and bars.
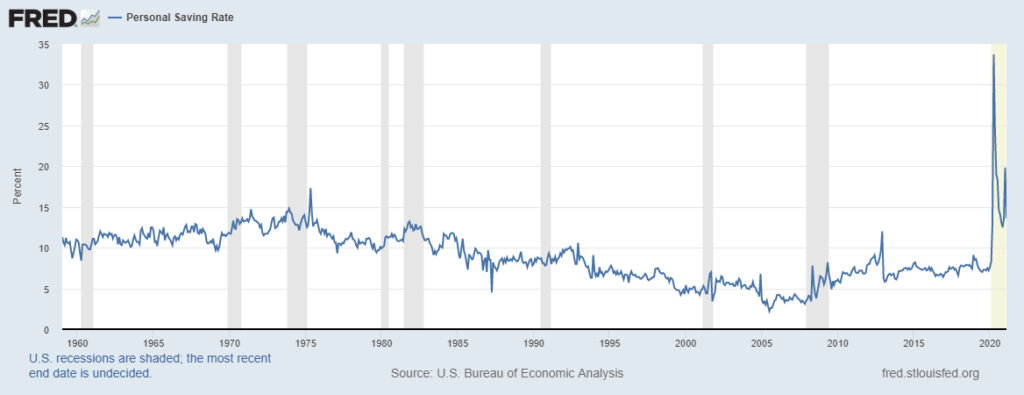
The green shoots in consumer
spending could be just the beginning of a spending juggernaut that will
unfold as more sectors of the economy open and the vaccination rate increases. The U.S.
personal saving rate, as reported
by the Federal Reserve Bank of St. Louis, currently 14%, stands
nearly twice its pre-pandemic level of 8%. If
consumers simply reduce their
savings to the former level and resume historic spending patterns a strong
economic rebound is on the near horizon.
Lastly, corporate earnings releases for the first quarter of 2021 began last week with several major banks reporting their first-quarter results. According to Bloomberg, profits for all 13 major banks easily exceeded Wall Street analysts’ expectations, driven by lower credit costs, active trading, and investment banking activity. Banking is the backbone of economic activity as lending to companies allows for growth and investment. Federal Reserve Chairman Jay Powell is committed to keeping rates low for as long as necessary to force an economic recovery. Low rates allow banks to borrow low and lend high – a simple equation for success and growth.
Low rates, consumers flush with cash, and widespread COVID-19 vaccine distribution continue to propel the economic recovery. The breadth of the recovery among economic sectors and across equity markets is pointing to the next phase of our economy when we move from recovery to expansion.
THE NUMBERS Sources: Index Returns: Morningstar Workstation. Past performance is no guarantee of future results. Indices are unmanaged and cannot be invested into directly. Three, five and ten year returns are annualized. Interest Rates: Federal Reserve, Mortgage Bankers Association.
MARKET HEAT MAP
The health of the economy is a key driver of long-term returns in the stock market. Below, we assess the key economic conditions that we believe are of particular importance to investors.
US ECONOMY
CONSUMER HEALTH
POSITIVE
Retail sales grew nearly 10%, month-over-month, in March.
CORPORATE EARNINGS
POSITIVE
Just about 10% of S&P 500 constituents have reported Q1 earnings, however, the early results are encouraging, as sales and earnings growth has come in at 7% and 30%, respectively.
EMPLOYMENT
NEUTRAL
The unemployment rate declined to 6% in March, from 6.2% in February.
INFLATION
POSITIVE
Inflation was 2.6% in March. The Fed plans to allow inflation to temporarily overshoot its 2% target such that the long-term average is 2%. Inflation has generally been tame since the Great Financial Crisis, less than 2%.
FISCAL POLICY
POSITIVE
President Biden recently unveiled a stimulus package directed towards infrastructure that would total more than $2 trillion over eight years.
MONETARY POLICY
VERY POSITIVE
The Federal Reserve continues to indicate that the monetary environment will remain very accommodative for the foreseeable future.
GLOBAL CONSIDERATIONS
GEOPOLITICAL RISKS
NEUTRAL
There are few, if any, looming geopolitical risks that could upset the economic recovery.
ECONOMIC RISKS
NEUTRAL
With multiple vaccines in distribution and highly accommodative fiscal and monetary policies in place, 2021 may be one of the strongest economic years on record.
The “Heat Map” is a subjective analysis based upon metrics that VNFA’s investment committee believes are important to financial markets and the economy. The “Heat Map” is designed for informational purposes only and is not intended for use as a basis for investment decisions.
Laurie can take your questions live on the air at 610-758-8810, or address
those submitted via yourfinancialchoices.com.
Recordings of past shows are available to listen or download at both yourfinancialchoices.com and wdiy.org.