
THE NUMBERS
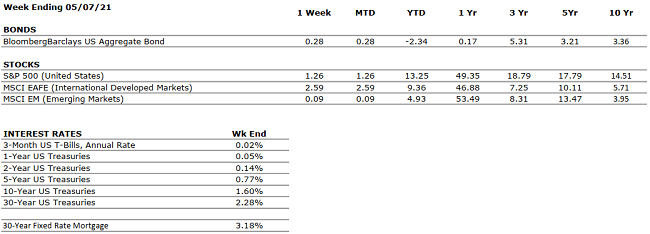 Sources: Index Returns: Morningstar Workstation. Past performance is no guarantee of future results. Indices are unmanaged and cannot be invested into directly. Three, five and ten year returns are annualized. Interest Rates: Federal Reserve, Mortgage Bankers Association.
MARKET HEAT MAP
The health of the economy is a key driver of long-term returns in the stock market. Below, we assess the key economic conditions that we believe are of particular importance to investors.
|
US ECONOMY |
||
|
CONSUMER HEALTH |
POSITIVE |
The economy expanded at a 6.4% annualized pace in Q1. At the current rate, U.S. GDP will return to pre-COVID levels by mid year. |
|
CORPORATE EARNINGS |
POSITIVE |
S&P 500 Q1 sales and earnings growth have come in at 9% and 45%, respectively, representing extremely strong results. |
|
EMPLOYMENT |
POSITIVE |
The unemployment rate increased to 6.1% in April, from 6% in March. |
|
INFLATION |
POSITIVE |
Inflation was 4.5% in April. The Fed plans to allow inflation to temporarily overshoot its 2% target such that the long-term average is 2%. Inflation has generally been tame since the Great Financial Crisis, less than 2%. |
|
FISCAL POLICY |
POSITIVE |
President Biden recently unveiled a stimulus package directed towards infrastructure that would total more than $2 trillion over eight years. President Biden is also considering a significant capital gains tax increase. |
|
MONETARY POLICY |
VERY POSITIVE |
The Federal Reserve continues to indicate that the monetary environment will remain very accommodative for the foreseeable future. |
|
GLOBAL CONSIDERATIONS |
||
|
GEOPOLITICAL RISKS |
NEUTRAL |
There are few, if any, looming geopolitical risks that could upset the economic recovery. |
|
ECONOMIC RISKS |
NEUTRAL |
With multiple vaccines in distribution and highly accommodative fiscal and monetary policies in place, 2021 may be one of the strongest economic years on record. |
The “Heat Map” is a subjective analysis based upon metrics that VNFA’s investment committee believes are important to financial markets and the economy. The “Heat Map” is designed for informational purposes only and is not intended for use as a basis for investment decisions.