The American Rescue Plan includes a significant overhaul of
the child tax credit, but only for the 2021 tax year. The IRS and Treasury
created a website for taxpayers to opt out of receiving advance payments, or to
provide information on status changes that would impact the amount of the
credit at https://www.irs.gov/credits-deductions/child-tax-credit-update-portal
Our VNFA Tax Department sent out personalized recommendations
to clients who may be affected last week. Please look for an e-mail from tax@valleynationalgroup.com, or
reach out to us with any questions.
by William Henderson, Vice President / Head of Investments Last week the markets showed conditions remain favorable for equities as easy financial conditions and a healthy economic recovery are firmly in place for the foreseeable future. All three major indices posted strong weekly returns adding to their very healthy year-to-date gains. The Dow Jones Industrial Average rose by +3.4% last week, the S&P 500 Index rose +2.7% and the NASDAQ increased by +2.4%. The “value-over-growth” trade seems to have waned as the major indices have moved into relative parity on a year-to-date basis. Year-to-date, the Dow Jones Industrial Average has returned +13.6%, the S&P 500 Index +14.8% and the NASDAQ +11.8%. Bonds continue to be well bid with yields remaining stubbornly low. The 10-year U.S. Treasury dropped six basis points last week to end at 1.51%.
Three additional factors boosted
the markets. First, all 23 major U.S. banks including
J. P. Morgan Chase, Bank of America, and PNC Bank passed
the Federal Reserve’s annual stress tests, which are
designed to test the
resilience of large banks under severe global recessionary conditions. Second,
after several weeks of negotiation, President
Biden and a bipartisan group of senators announced an
agreement
on an infrastructure deal that could carve
out up to $1 trillion from
the $2.25 trillion American Jobs Plan that was released
in March 2021. The agreement focuses on traditional infrastructure such as
roads and bridges as well as water infrastructure and broadband internet access. The
deal is a positive development because it comes with no
new taxes and instead is funded
by hodgepodge of revenue sources including repurposing
unused pandemic relief funds, tougher Internal Revenue Service tax collection,
and selling oil from the Strategic Petroleum Reserve. And
third, inflation fears are modestly abating as
supply chain pressures have eased and prices for
basic commodities, including metals and lumber, fell
from their recent spikes.
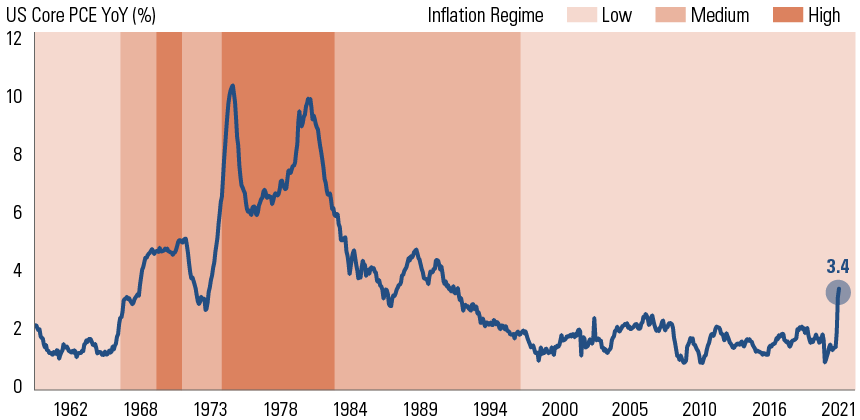
It is important to keep inflation
concerns in the proper perspective. The chart
below shows the long-term U.S. Core PCE (Personal
Consumption Expenditure) year-over-year percent
change. The recent jump in U.S. Core PCE
of +3.4%, is not that significant when you look at inflation over a much longer
term. The Fed’s goal of +2.0% average annual
inflation remains in place,
which means rates remain low for longer.
U.S. Core Personal
Consumption Expenditure (PCE)
(Source:
Bloomberg & Goldman Sachs June 2021)
As we move to close the second
quarter, corporate earnings announcements most
likely will surprise to the upside and revenue growth will remain robust. However,
companies may have to
deal with cost increases due to supply chain disruptions and
higher wages going forward. The economic tailwinds for the second half of
2021 will be consumer driven rather than stimulus driven.
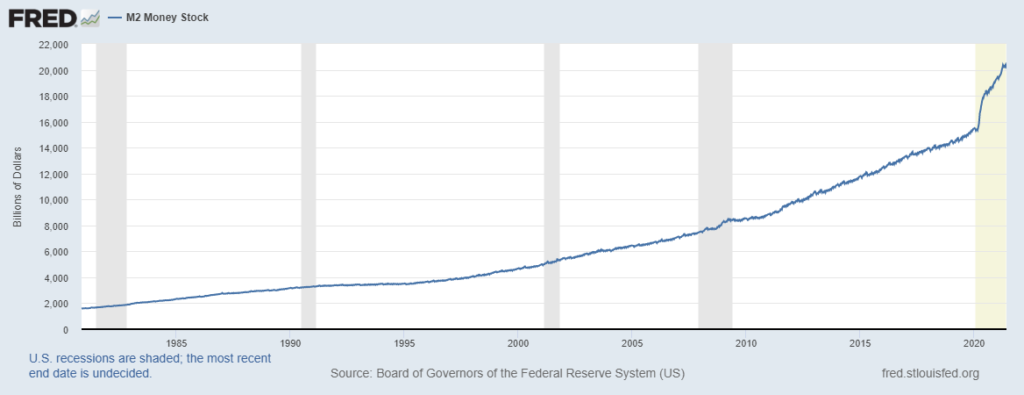
Consumers are in excellent
financial shape with personal savings accounts at record levels. According
to the Federal Reserve Bank of St. Louis, M2, the money supply measure that
includes cash, checking deposits and money market funds, reached $20.3 trillion
on June 22, 2021 (See chart above). There
is massive pent up demand
for travel and leisure; and with summer upon us, watch
for the consumer to fuel the economy and the Fed to keep the pump primed.
THE NUMBERS Sources: Index Returns: Morningstar Workstation. Past performance is no guarantee of future results. Indices are unmanaged and cannot be invested into directly. Three, five and ten year returns are annualized. Interest Rates: Federal Reserve, Mortgage Bankers Association.
MARKET HEAT MAP
The health of the economy is a key driver of long-term returns in the stock market. Below, we assess the key economic conditions that we believe are of particular importance to investors.
US ECONOMY
CONSUMER HEALTH
POSITIVE
The OECD forecasts that the global economy will grow 5.6% and 4.4% in 2021 and 2022, respectively.
CORPORATE EARNINGS
POSITIVE
S&P 500 Q1 sales and earnings growth were very strong. Corporate earnings are likely to remain strong throughout 2021 on a “year-over-year” basis as companies compare their results to depressed 2020 numbers.
EMPLOYMENT
POSITIVE
In May, the unemployment rate declined to 5.8%, from 6.1% in April.
INFLATION
NEUTRAL
Inflation was 4.5% in April. Inflation has generally been tame since the Great Financial Crisis, less than 2%; however, prices have been increasing in 2021 as a result of a tight labor market and supply chain constraints. The debate at-hand is whether recent inflation numbers are merely passing or here to stay.
FISCAL POLICY
POSITIVE
President Biden recently unveiled a stimulus package directed towards infrastructure that would total more than $2 trillion over eight years. President Biden is also considering a significant capital gains tax increase.
MONETARY POLICY
POSITIVE
The Federal Reserve indicated this week that it plans to hike rates twice in 2023. Previously, the Fed had suggested it would not raise rates until 2024. Nonetheless, the monetary stance is accommodative in the near future.
GLOBAL CONSIDERATIONS
GEOPOLITICAL RISKS
NEUTRAL
There are few, if any, looming geopolitical risks that could upset the economic recovery.
ECONOMIC RISKS
NEUTRAL
With multiple vaccines in distribution and highly accommodative fiscal and monetary policies in place, 2021 may be one of the strongest economic years on record. If a risk is present, it may be that the economy will overheat, thereby leading to inflation and higher interest rates.
The “Heat Map” is a subjective analysis based upon metrics that VNFA’s investment committee believes are important to financial markets and the economy. The “Heat Map” is designed for informational purposes only and is not intended for use as a basis for investment decisions.
We are pleased to
welcome Debra Almack, CPA, to our team as a Senior Accountant. Debra has been a
Certified Public Accountant for almost 30 years, and she has a breadth of
experience in tax and corporate accounting. She will work with our Chief
Financial Officer as part of the internal finance and accounting team based in
our Bethlehem headquarters.
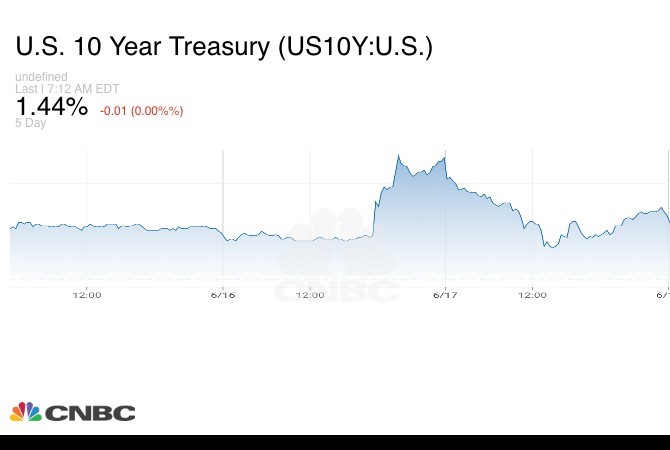
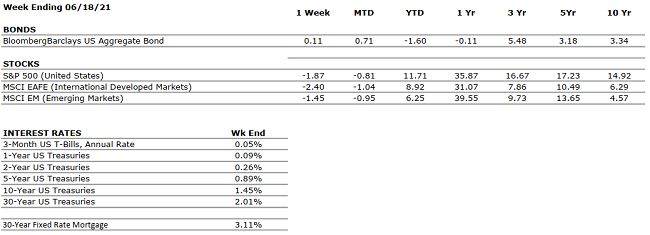
by William Henderson, Vice President / Head of Investments Last week, the markets saw negative returns after posting positive gains for several consecutive weeks. Of the three major indexes, the Dow Jones Industrial Average saw the biggest weekly decline, and the largest decline for that index in more than eight months. Value-style stocks once again underperformed growth stocks as the NASDAQ saw only a modest pullback. For the week that ended June 18, 2021, the Dow Jones Industrial Average lost -3.5%, the S&P 500 Index fell by -1.9%, and the NASDAQ fell by only -0.3%. Modest pullbacks are to be expected in any healthy stock market and last week’s negative returns did not significantly chip away at this year’s strong year-to-date returns. Year-to-date, the Dow Jones Industrial Average has returned +9.8%, the S&P 500 Index +11.7%, and the NASDAQ +9.2%. Bonds had a quick reversal during the week, with the 10-year U.S. Treasury initially spiking to 1.57% after the Federal Open Market Committee (FOMC) announcement about interest rates (more on that below) but calmed down by week’s end to close at 1.44%. (See the 5-day chart below of the U.S. 10-year Treasury Note – CNBC)
The news of the week was certainly the FOMC meeting and the follow-up press conference by Chairman Jay Powell. The Fed raised its inflation forecast, and a dot plot of individual central bank members’ expectations on policy, signaled that an interest hike could happen sooner than expected, in 2023. Investors typically get spooked with the mention of higher interest rates, as cheaper (lower) rates help to spur economic growth. Further, St. Louis Fed President James Bullard told CNBC on Friday that he expected an initial rate increase to happen even sooner in 2022. “We’re expecting a good year, a good reopening. But this is a bigger year than we were expecting, more inflation than we were expecting,” Bullard said on CNBC’s Squawk Box. “I think it’s natural that we’ve tilted a little bit more hawkish here to contain inflationary pressures.” That comment was in direct contradiction of Powell’s press conference comments that higher interest rates were not expected until 2023-24.
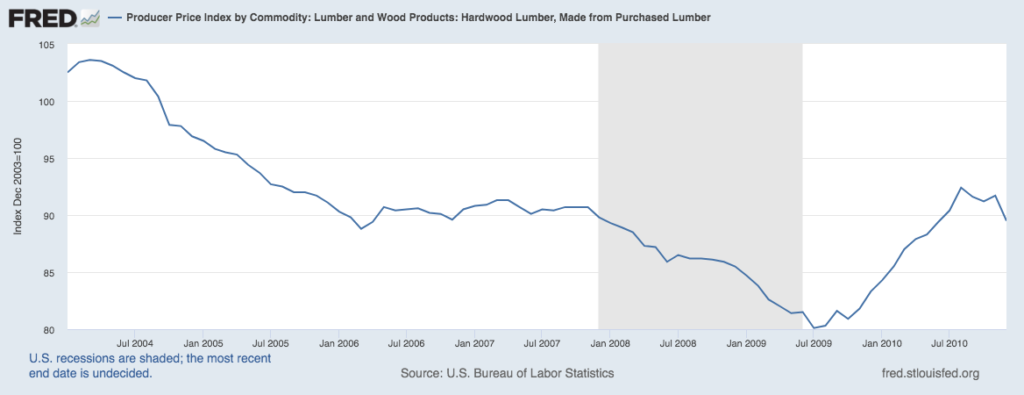
Clearly, the markets are seeing
the trends. First, global stimulus in the form of dollars to consumers is fading, which
will lead to a contraction in in M2 (supply of
money and savings). Second,
the temporary demand/supply imbalances are ebbing allowing commodity
prices to stabilize (lumber,
critical for new building, led the way lower – see chart
below from the Federal Reserve Bank of St. Louis).
Third, the global economic rebound is continuing and
now includes the Eurozone. These trends overall are
positive for the market and continued economic growth, but
they also point to inevitably higher interest rates in the not-to-distant future. The
Fed will watch for inflation, which thus far has appeared (as mentioned last
week, with the 5% jump
in the Consumer
Price Index). The question remains about
whether the inflation will be transitory or more permanent. For us,
the picture remains clear: last year featured collapsing global growth and
massive stimulus. Looking at 2021-23 we see healthy growth and a
cooperating Federal Reserve that is timid about raising interest rates too
quickly.
THE NUMBERS Sources: Index Returns: Morningstar Workstation. Past performance is no guarantee of future results. Indices are unmanaged and cannot be invested into directly. Three, five and ten year returns are annualized. Interest Rates: Federal Reserve, Mortgage Bankers Association.
MARKET HEAT MAP
The health of the economy is a key driver of long-term returns in the stock market. Below, we assess the key economic conditions that we believe are of particular importance to investors.
US ECONOMY
CONSUMER HEALTH
POSITIVE
The OECD forecasts that the global economy will grow 5.6% and 4.4% in 2021 and 2022, respectively.
CORPORATE EARNINGS
POSITIVE
S&P 500 Q1 sales and earnings growth were very strong. Corporate earnings are likely to remain strong throughout 2021 on a “year-over-year” basis as companies compare their results to depressed 2020 numbers.
EMPLOYMENT
POSITIVE
In May, the unemployment rate declined to 5.8%, from 6.1% in April.
INFLATION
NEUTRAL
Inflation was 4.5% in April. Inflation has generally been tame since the Great Financial Crisis, less than 2%; however, prices have been increasing in 2021 as a result of a tight labor market and supply chain constraints. The debate at-hand is whether recent inflation numbers are merely passing or here to stay.
FISCAL POLICY
POSITIVE
President Biden recently unveiled a stimulus package directed towards infrastructure that would total more than $2 trillion over eight years. President Biden is also considering a significant capital gains tax increase.
MONETARY POLICY
POSITIVE
The Federal Reserve indicated this week that it plans to hike rates twice in 2023. Previously, the Fed had suggested it would not raise rates until 2024. Nonetheless, the monetary stance is accommodative in the near future.
GLOBAL CONSIDERATIONS
GEOPOLITICAL RISKS
NEUTRAL
There are few, if any, looming geopolitical risks that could upset the economic recovery.
ECONOMIC RISKS
NEUTRAL
With multiple vaccines in distribution and highly accommodative fiscal and monetary policies in place, 2021 may be one of the strongest economic years on record. If a risk is present, it may be that the economy will overheat, thereby leading to inflation and higher interest rates.
The “Heat Map” is a subjective analysis based upon metrics that VNFA’s investment committee believes are important to financial markets and the economy. The “Heat Map” is designed for informational purposes only and is not intended for use as a basis for investment decisions.