
“Age is something that doesn’t matter, unless you are a cheese.” – Luis Bunuel
Daily Archives: June 15, 2021
Current Market Observations
by William Henderson, Vice President / Head of Investments
While the markets closed the week with mixed returns, we saw a big move in technology stocks as the NASDAQ inched higher by nearly 2% versus a smaller move in the S&P 500 and a negative return for the Dow Jones Industrial Average. For the week that ended June 11, 2021, the Dow Jones Industrial Average lost -0.8%, the S&P 500 Index added just +0.4% while the NASDAQ jumped higher by +1.9%. Year-to-date returns on all three major indices remain comfortably in positive territory; especially given the NASDAQ’s recent run up which moves its returns more in line with the other broader indices for the full year. Year-to-date, the Dow Jones Industrial Average has returned +13.7%, the S&P 500 Index +13.8%, and the NASDAQ +9.5%. Bonds continued their move lower in yield last week with the 10-year U.S. Treasury Bond falling another 10 basis points to 1.46% from 1.56% the previous week. Strong inflation data, which we will talk more about below, has not budged the Fed’s ongoing zero interest rate policy, which seemingly keeps a lid on higher bond yields.
Last week, we saw inflation as measured by the consumer price index (CPI) rise 5.0% from a year ago. The core index, which excludes food and energy, rose 3.8%; the largest 12-month increase since 1992. (See chart below from YCharts of US Consumer Price Index YOY).
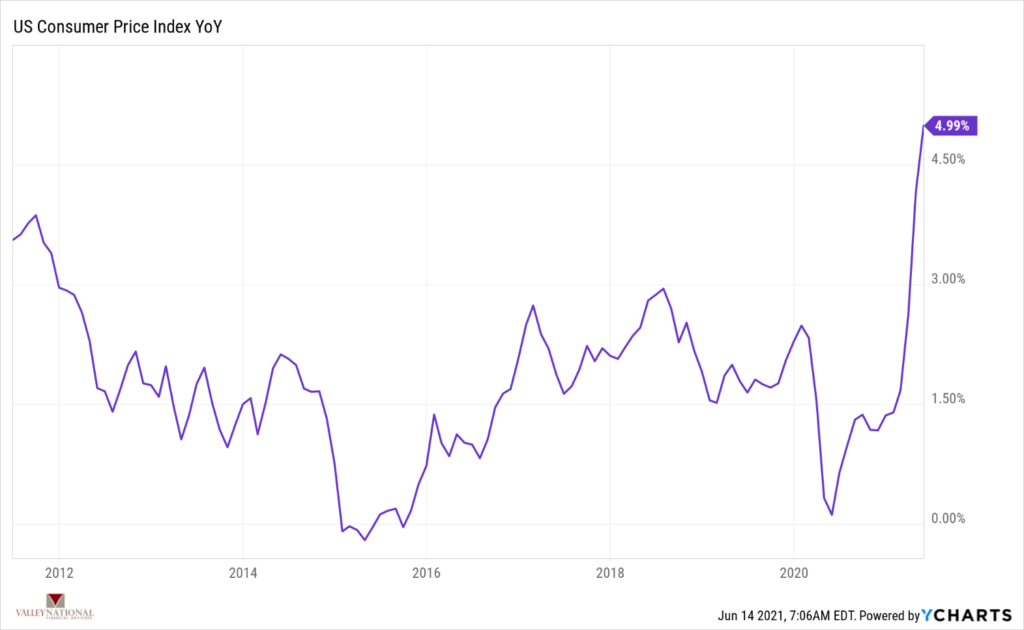
The Federal Reserve continues to view current inflationary trends as “transitory” or temporary and solely based on easy monetary and fiscal policies currently in place. Further, the price changes reflected in the recent jump in CPI were largely skewed to those sectors of the economy most impacted by the pandemic (e.g. travel & leisure and hospitality). See the price change examples below reported by the Federal Reserve Bank of St. Louis:
- Car Rental: 12.1% M/M May; 16.2% M/M April
- Airline fares: 7.0% M/M May; 10.2% M/M April
- Used Vehicles: 7.3% M/M May; 10.0% M/M April
The Fed views these significant moves in prices as transitory, relegated to a few “reopening” sectors and largely the result of recent stimulus checks sent to consumers in March 2021. As we have reported, and the Fed has confirmed, their long-term goal is for inflation to average 2.0%. Given that we have had many years of sub-2.0% inflation numbers, seeing inflation well above 2.0% (such as last week’s +5.0%) is just what the Fed has ordered for the economy.
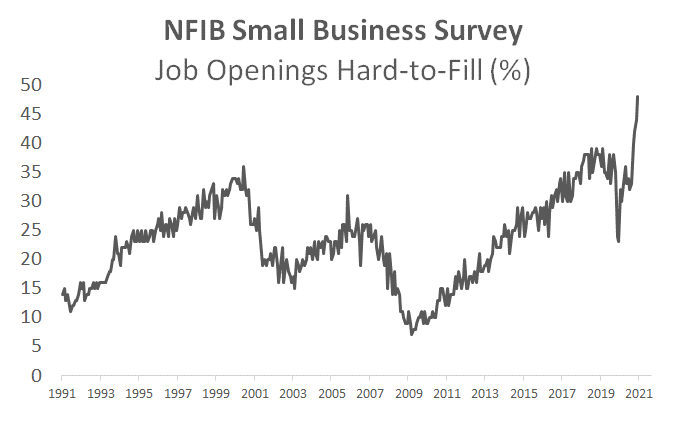
While the Fed is feigning obeisance around the inflation data, the consumer may be embedding fast-rising prices as something more than transitory. Also, some recent evidence of surveys from small businesses suggests that wage growth could be accelerating, which could increase the chance of sustained inflationary pressures as wages are harder to cut once in place. Last week, the “Job Openings Hard-to-Fill” component of the NFIB small business survey reached an all-time high (see chart below from Bloomberg). Jobs in leisure and hospitality are coming back but, with a higher compensation structure because employers are struggling to fill positions.
As noted above, both the equity and bond markets brushed off the inflation numbers released last week; and instead, are banking on the Fed and siding with the “transitory” story. The Fed remains committed to keeping rates lower for longer and thereby assuring we have a strong and sustained economic recovery on the heels of the pandemic recession of 2020. Investors, rarely more efficient than the market, just might be taking heed of the old Wall Street adage, “Don’t Fight the Fed.” We are certainly in that camp and believe long-term, diversified investors almost always win in the end.
The Numbers & “Heat Map”
THE NUMBERS
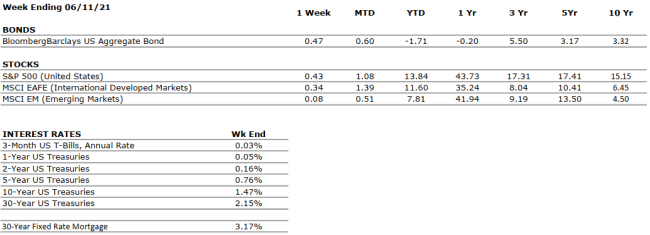 Sources: Index Returns: Morningstar Workstation. Past performance is no guarantee of future results. Indices are unmanaged and cannot be invested into directly. Three, five and ten year returns are annualized. Interest Rates: Federal Reserve, Mortgage Bankers Association.
MARKET HEAT MAP
The health of the economy is a key driver of long-term returns in the stock market. Below, we assess the key economic conditions that we believe are of particular importance to investors.
|
US ECONOMY |
||
|
CONSUMER HEALTH |
POSITIVE |
The OECD forecasts that the global economy will grow 5.6% and 4.4% in 2021 and 2022, respectively. |
|
CORPORATE EARNINGS |
POSITIVE |
S&P 500 Q1 sales and earnings growth were very strong. Corporate earnings are likely to remain strong throughout 2021 on a “year-over-year” basis as companies compare their results to depressed 2020 numbers. |
|
EMPLOYMENT |
POSITIVE |
In May, the unemployment rate declined to 5.8%, from 6.1% in April. |
|
INFLATION |
POSITIVE |
Inflation was 4.5% in April. The Fed plans to allow inflation to temporarily overshoot its 2% target such that the long-term average is 2%. Inflation has generally been tame since the Great Financial Crisis, less than 2%; however, prices have been increasing in 2021 as a result of a tight labor market and supply chain constraints. |
|
FISCAL POLICY |
POSITIVE |
President Biden recently unveiled a stimulus package directed towards infrastructure that would total more than $2 trillion over eight years. President Biden is also considering a significant capital gains tax increase. |
|
MONETARY POLICY |
VERY POSITIVE |
The Federal Reserve continues to indicate that the monetary environment will remain accommodative for the foreseeable future. |
|
GLOBAL CONSIDERATIONS |
||
|
GEOPOLITICAL RISKS |
NEUTRAL |
There are few, if any, looming geopolitical risks that could upset the economic recovery. |
|
ECONOMIC RISKS |
NEUTRAL |
With multiple vaccines in distribution and highly accommodative fiscal and monetary policies in place, 2021 may be one of the strongest economic years on record. If a risk is present, it may be that the economy will overheat, thereby leading to inflation and higher interest rates. |
The “Heat Map” is a subjective analysis based upon metrics that VNFA’s investment committee believes are important to financial markets and the economy. The “Heat Map” is designed for informational purposes only and is not intended for use as a basis for investment decisions.
“Your Financial Choices”
Tune in Wednesday, 6 PM for “Your Financial Choices” show on WDIY 88.1FM. Laurie will discuss: ‘This & That’ – Various Financial Planning Questions
Laurie can address questions submitted via yourfinancialchoices.com. Recordings of past shows are available to listen or download at both yourfinancialchoices.com and wdiy.org.