The IRS accepts
online payments. To begin using the IRS online
services, taxpayers must first create an online account. New York also requires
account setups to submit payments online. Pennsylvania will allow a taxpayer to
make income tax payments without the creation of an online account. New Jersey allows one time or scheduled online payments
without a personal login. Our Tax Department has created a step-by-step guide
to setting up and using these online payment portals. It is available HERE
and on our website at valleynationalgroup.com/tax
Many other states also offer electronic payments options.
Please contact us if
you have any questions regarding these other state payments.
by William Henderson, Vice President / Head of Investments Markets were weaker across the board last week as each major index show a negative return. Further, as noted earlier last month, September proved to be a losing month overall, keeping with stock market history. Last week, the Dow Jones Industrial Average lost -1.4%, the S&P 500 Index lost -2.2% and the NASDAQ closed -3.2% lower. Poor weekly showing by the indexes chipped away at year-to-date gains, but each major index remains solidly in the black column. Year-to-date, the Dow Jones Industrial Average has returned +13.7%, the S&P 500 Index +17.3% and the NASDAQ +13.6%. Bond yields rose last week as implications of reduced monetary stimulus, inflation concerns and the Fed’s previous announcement of bond purchase tapering by year 2021, sank in and investors reacted accordingly. The 10-year U.S Treasury closed the week at 1.49%, eight basis points higher than the previous week but still below the March 2021 high of 1.74%.
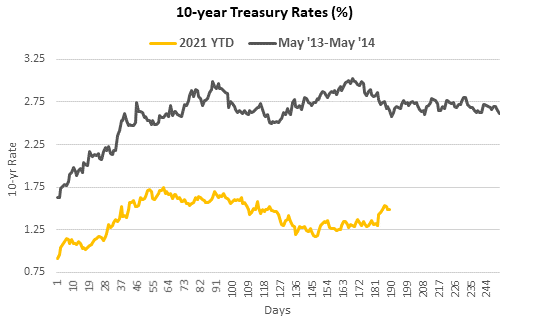
Much has been made of the Fed’s tapering and parallels have been drawn between the 2013-2014 “Taper Tantrum,” where the Fed previously announced and subsequently followed through with a substantial tapering of bond purchases. The chart below from Bloomberg shows the 10-year U.S. Treasury during two periods of rising rates (2013-2014) and (YTD 2021). In both instances, rates rose, and volatility entered the bond markets. However, also during both periods, the stock market continued its broader bull runs.
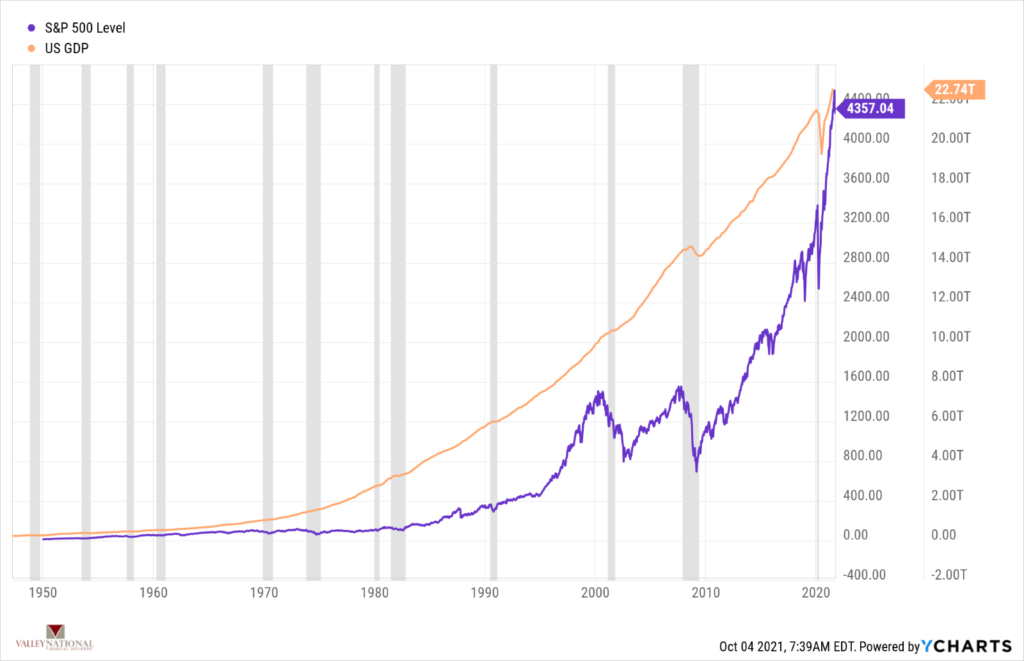
In our opinion, bond yields are impacted by
the Fed while they maneuver through economic recessions and expansions, while
the stock market is impacted by
demographic trends and global macroeconomic factors such as GDP growth and
population growth. This
is evidenced by
the chart below from YCharts and
VNFA, where we show U.S. GDP and the S&P 500 Index from 1950 to present
with recessions shaded. Notice the trend, from bottom
left to upper right; and during all this time we had periods of bond yields
falling and rising as impacted by
the Federal Reserve’s monetary policy. Certainly,
volatility in markets will never go away but trends are here to stay.
Looking beyond the U.S. economy
and markets, we see some
economic headwinds in a few places. China,
the second largest economy behind the U.S., is
dealing with supply chain concerns,
energy shortages and fall out
from Evergrande, the world’s largest indebted real
estate developer, where bond holders are still awaiting
their interest payment. Inflationary concerns are
shared in many parts of the world as energy prices, food prices and labor
shortages compound each other putting serious headwinds in
the way of a global recovery from pandemic. In the
U.S., lawmakers are still debating spending bills and
an increase in the federal debt limit;
both of which add unneeded uncertainty to the markets. While
no one expects the U.S. Government to default on its debt, the
anxiety produced by pandering on both sides of the aisle
in Congress does not help the markets. Both
sides know the debt limit must be increased but
neither wants to be held responsible for adding more to
the mountain of federal debt which already exceeds $28
trillion (about $86,000 per person in the U.S.).
It is likely that the debt limit
will be increased in the eleventh hour simply because the result of not
doing so would be catastrophic and neither side of
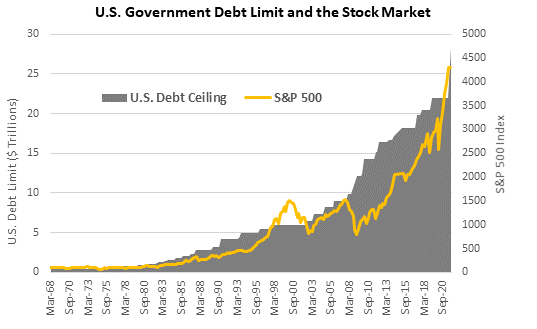
Congress wants that to happen. Given how relatively
low interest rates are, the cost of borrowing by the government to
finance its activities also remains historically
low; thereby naturally permitting greater
amounts of debt. See the chart below from
Bloomberg showing U.S. Government Debt limit levels and the S&P 500 Index. The
market has consistently proved itself to be more efficient and forward thinking
than our own congressional leaders.
We
expect the Fed to keep interest rates low even as they engage in bond purchase
tapering. The economy will continue to
improve while dealing with COVID-19
variants, supply chain issues, higher energy and raw material prices, and
squabbling in Washington but volatility in the markets is the result. Keep
focused on long-term trends and returns rather than the short-term volatility.
THE NUMBERS Sources: Index Returns: Morningstar Workstation. Past performance is no guarantee of future results. Indices are unmanaged and cannot be invested into directly. Three, five and ten year returns are annualized. Interest Rates: Federal Reserve, Mortgage Bankers Association.
MARKET HEAT MAP
The health of the economy is a key driver of long-term returns in the stock market. Below, we assess the key economic conditions that we believe are of particular importance to investors.
US ECONOMY
CONSUMER HEALTH
POSITIVE
August retail sales surprised to the upside, increasing 0.7% month-over-month, indicating that the Delta variant has not had a material impact on the U.S. economy.
CORPORATE EARNINGS
POSITIVE
S&P 500 Q2 sales and earnings grew an astonishing 25% and 89% respectively, when compared to the heavily depressed figures from Q2 2020.
EMPLOYMENT
POSITIVE
The unemployment rate is down to 5.2%. In August, new job creation was disappointing, but jobless claims were as low as they have been since March 2020.
INFLATION
NEUTRAL
CPI rose 5.3% year-over-year in August; CPI rose 5.4% in both June and July respectively. Fed Chairman Jay Powell is resolute that the high inflation is transitory and will decelerate as global supply chain bottlenecks resolve. Meanwhile, consumers expect CPI to be 5.2% over the next 12 months.
FISCAL POLICY
POSITIVE
Congress came to a resolution to avoid the government shutdown through early December, but the debt ceiling still looms, which Treasury Secretary Yellen believes will be reached on October 18. Nonetheless, Democrats can adjust the debt ceiling without Republican support through budget reconciliation, so it seems likely a solution will be reached.
MONETARY POLICY
POSITIVE
In recent communications, the Fed has indicated bond tapering may begin by the end of 2021 while rate hikes could commence by the end of 2022. Nonetheless, monetary policy remains relatively accommodative with rates at historical lows.
GLOBAL CONSIDERATIONS
GEOPOLITICAL RISKS
NEUTRAL
Although the Taliban’s control in Afghanistan is concerning, it is unlikely to have a meaningful economic impact.
ECONOMIC RISKS
NEUTRAL
Supply chain disruptions caused by the Delta variant are hampering the economy, however, demand remains very strong. While supply bottlenecks will likely arise over time as new strains surface, the hold-ups appear primarily transitory and should ease progressively in a post-COVID world.
The “Heat Map” is a subjective analysis based upon metrics that VNFA’s investment committee believes are important to financial markets and the economy. The “Heat Map” is designed for informational purposes only and is not intended for use as a basis for investment decisions.