by William
Henderson, Vice President / Head of Investments The equity markets reacted negatively to
the discovery of a
new highly transmissible COVID-19 variant
in South Africa. The announcement of a new strain, dubbed omicron by the World
Health Organization, shocked markets and impacted
most major sectors. The Dow Jones
Industrial Average dropped by -2.7%, the S&P
500 Index fell by -2.3% and
the NASDAQ dropped by -3.1%. However,
all three major indexes remain in
positive territory for the year. Year-to-date,
the Dow Jones Industrial Average has returned +15.9%,
the S&P 500 Index +23.9%
and the NASDAQ +20.9%. The U.S.
Treasury market
reacted as expected to bad
news,
with prices rising on bonds,
reminding investors why bonds
remain an anchor in most
portfolios – providing the needed
risk management tool while risk assets
are selling off. Last Friday, the 10-year
U.S. Treasury briefly dipped below
1.50%, before settling
in over the weekend at 1.53%, four basis
points lower than
last week and well below the 1.74%
level reached in March of this year.
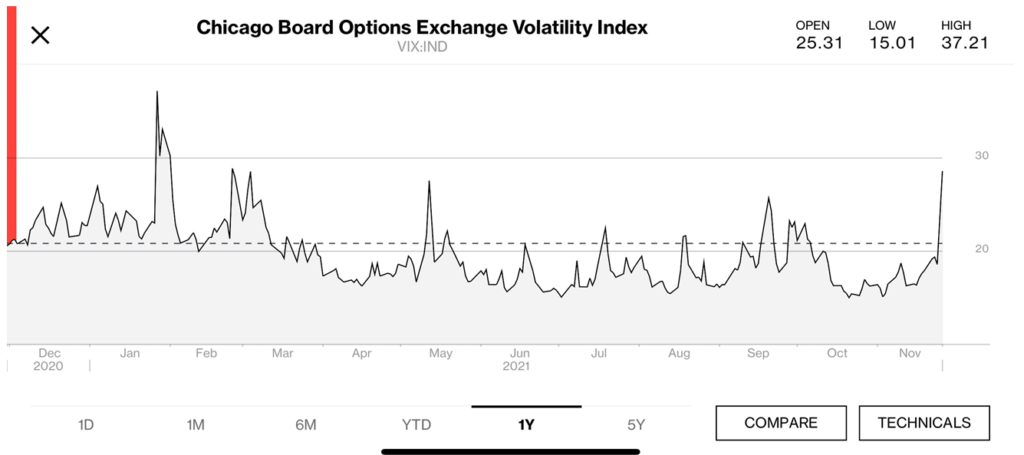
Last week, we
talked about the VIX (CBOE
Volatility Index – or measure of
the market’s risk level) and
how “calm” the VIX
had been thus far in 2021.
Well, add in an omicron variant,
and the VIX spikes to
a 10-month
high. See
the chart below from Bloomberg.
As of the writing
of this
article, the markets are already rebounding nicely, and
many market prognosticators
are calling it a “buying opportunity.” We
often get that question: “Is this
a buying opportunity?” Our
answer is always the same: “YES!” If
you are a long-term investor, with appropriate risk levels applied
to your portfolio, every
day is a buying opportunity as time
generally smooths out peaks
and valleys in the markets.
Certainly, this
new COVID-19 variant
puts the unknown
element back into the
markets, but we have seen this before
with the delta variant and
the pharmaceutical firms are
already touting the
need for another booster
shot to deal with the omicron variant. Further, FED
policy markets are well aware of
the issue and resultant
market and economic
implications. This means that
their announced monetary policy tightening, and bond purchase
tapering could at any time be adjusted.
In fact, trading markets
are already pushing out their expectations
of the first rate
hike to July 2022 from June 2022.
Lastly, there seems to
be an overall consensus gathering in Washington and
Wall Street that
the pandemic is becoming endemic and
will be with us in some form or another for
quite a
long time. For each sector negatively
impacted by lockdowns
and new COVID strains such as
travel & leisure, there
are sectors that are
positively impacted such as technology and
bio-tech. There are a
lot of economic indicators being released
this week including
data around retail
sales, home prices
and the labor markets. This
information will give us needed information
about the future of the economy, the
direction of Fed policy and
the sentiment and strength
of the consumer. Inflation continues
to be a concern and
the question remains
about which parts of inflation will be
transitory vs. permanent.
Certainly, last week was a
sell-off in all market sectors but we have talked about sell-offs occurring in
every major bull market – so this is generally typical market behavior. However,
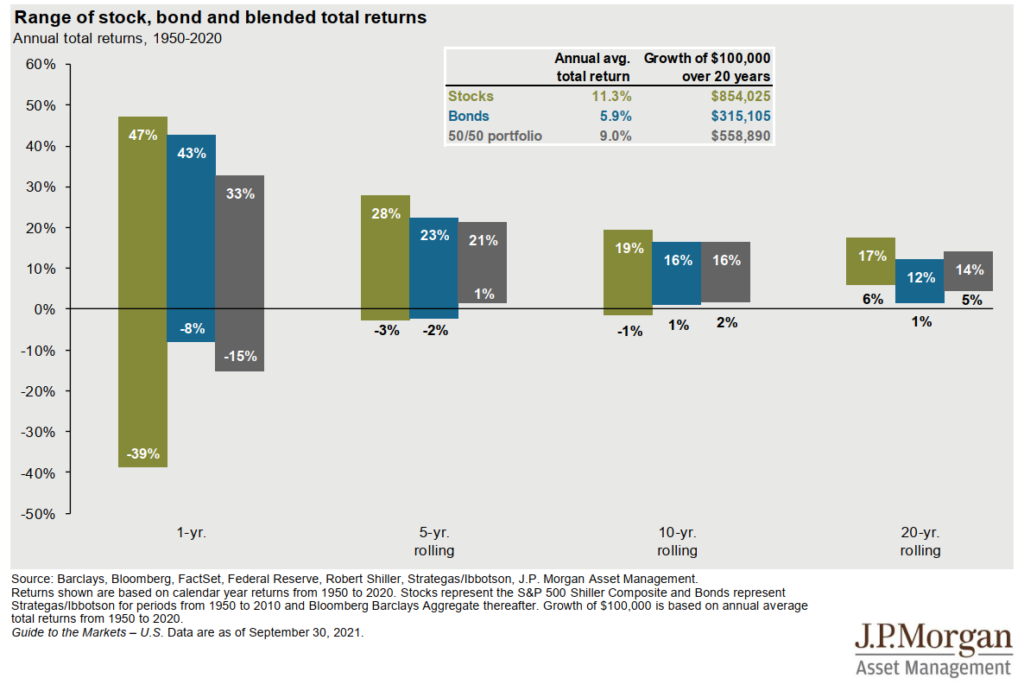
over
long periods of time, sell-offs are simply blended into long-term
returns. See the chart below from JP Morgan showing performance of portfolios over
time.
In any given single year,
equities alone can produce a return of –39% and a blended portfolio of
–15%. Looking out 20 years, both portfolios are in positive
territory. Simply put – investing is a long-term activity.
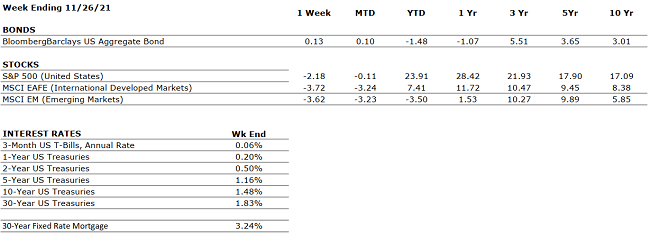
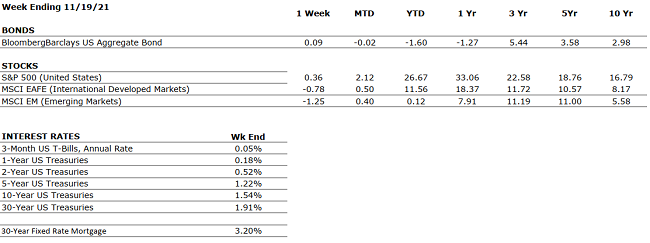
THE NUMBERS Sources: Index Returns: Morningstar Workstation. Past performance is no guarantee of future results. Indices are unmanaged and cannot be invested into directly. Three, five and ten year returns are annualized. Interest Rates: Federal Reserve, Mortgage Bankers Association.
MARKET HEAT MAP
The health of the economy is a key driver of long-term returns in the stock market. Below, we assess the key economic conditions that we believe are of particular importance to investors.
US ECONOMY
CONSUMER HEALTH
POSITIVE
U.S. GDP growth decelerated to a 2% annualized pace in Q3. The slowdown was driven primarily by supply chain constraints. Economists expect a modest acceleration in Q4.
CORPORATE EARNINGS
POSITIVE
With 95% of S&P 500 companies having reported Q3 results, sales and earnings are up 17.5% and 39%, respectively. However, company commentary suggests that the supply chain has been and will continue to be problematic in the coming quarters.
EMPLOYMENT
POSITIVE
The unemployment rate is down to 4.6%, as of October. The labor market is very tight at present as many employers, particularly in the Leisure and Logistics sectors, are struggling to fully staff because the labor participation rate remains below pre-COVID levels. The labor shortage is one of the causes of the global supply chain glut.
INFLATION
NEUTRAL
CPI rose 6.2% year-over-year in October, the highest increase since 1990, driven by the global supply chain backlog. Will inflation be transitory or permanent?
FISCAL POLICY
POSITIVE
A $1.2 trillion infrastructure bill was passed by Congress. A $1.75 trillion spending bill passed by Congress also went to Senate for revisions.
MONETARY POLICY
POSITIVE
The Fed will begin bond tapering by November’s end. By mid-2022, all Fed bond purchases will halt. The Fed’s bond buying program works to keep interest rates low. Inflation concerns are persisting, and some are calling for faster tapering and high rates.
GLOBAL CONSIDERATIONS
GEOPOLITICAL RISKS
NEUTRAL
A new COVID-19 variant, omicron, was discovered in South Africa and countries around the world immediately reacted by closing borders to foreigners. While still new and unknown, this needs to be closely watch for potential long-term impact globally and risks of new “lockdowns,” which could severely impact economic recoveries.
ECONOMIC RISKS
NEUTRAL
Supply chain disruptions are hampering the economy; however, demand remains very strong. While global logistics are operating far below normal efficacy, it appears the supply chain is slowly improving and may reach normalcy by mid-to-late-2022.
The “Heat Map” is a subjective analysis based upon metrics that VNFA’s investment committee believes are important to financial markets and the economy. The “Heat Map” is designed for informational purposes only and is not intended for use as a basis for investment decisions.
“Tomorrow is the most
important thing in life. Comes in to us at midnight very clean. It’s perfect
when it arrives and it puts itself in our hands, and hopes we’ve learned
something from yesterday.” – John Wayne
Laurie can
address questions on the air that are submitted either in advance or during the
live show via yourfinancialchoices.com.
Recordings of past shows are available to listen or download at both yourfinancialchoices.com and wdiy.org.
This week our offices will be closed for the Thanksgiving holiday on Thursday, November 25. Our offices will also close early (1 p.m.) with the markets on Friday, November 26.
The IRS released a one-page guide for taxpayers to protect from identity theft. The PDF includes tips on keeping your computer and mobile phone secure, advice to avoid phishing scams and malware, and resources to protect your tax return. View and download the guide at https://www.irs.gov/pub/irs-pdf/p4524.pdf.
by William Henderson, Vice President / Head of Investments Last week saw a mixed market as the S&P 500 and the NASDAQ posted slight gains, but the Dow Jones Industrial Average sold off as industrial sectors such as materials, energy, and financials showed weakness. For the week’s end, the Dow Jones Industrial Average fell -1.4%, while the S&P 500 Index increased by +0.3% and the NASDAQ jumped by +1.2%. Across all major market indexes, year-to-date returns remain solid, pointing to a potentially record setting 2021. Year-to-date, the Dow Jones Industrial Average has returned +18.3%, the S&P 500 Index +26.7%, and the NASDAQ +25.3%. The 10-year U.S Treasury moved higher by two basis points closing the week at 1.57%, modestly below 1.74% level reached in March of this year. Strong inflation pressures are hinting that the Fed’s tapering of bond purchases may accelerate, and higher short-term rates could be sooner than mid-2022 as economists had predicted.
With the Thanksgiving holiday this week, the House narrowly passed President Biden’s $1.75 trillion social spending bill, sending it to the Senate. It is widely expected that the bill will languish in the Senate for several weeks where further revisions will take place. The only important news out of Washington this week was President Biden’s nomination for Federal Reserve Chair, Jerome Powell, to serve an additional term. The race for this critically important post had come down to either keeping Jay Powell for an additional term or nominating Fed Governor Lael Brainard as his replacement. As we have said often, uncertainty is the one thing the markets really fear so keeping Powell on board soothed the markets. Brainard was nominated as Vice Chair.
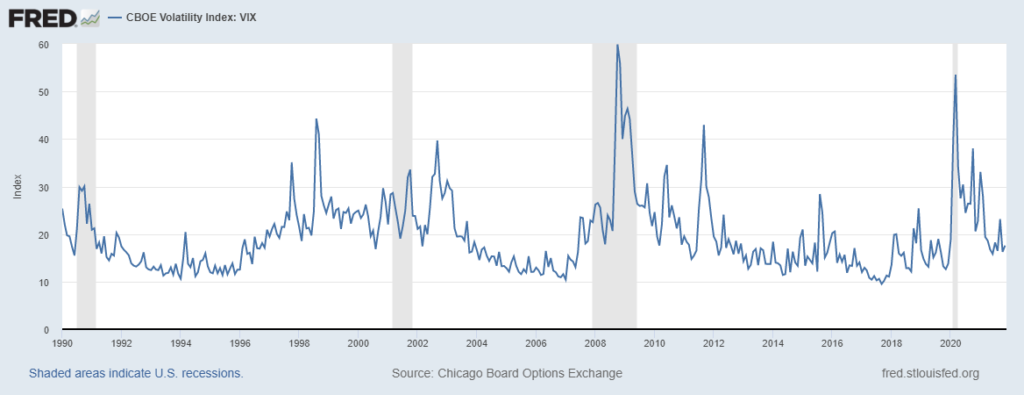
While inflation is running hot, and COVID-19 cases are rising outside of the U.S., the markets do not seem concerned. Look at the chart below from the Federal Bank of St. Louis showing the CBOE Volatility Index or VIX. The VIX measures the market expectation of near-term volatility conveyed by stock index option prices; essentially a quantitative way to measure risk, fear, and stress in the markets. The VIX is currently trading well below the “panic” levels seen at the beginning of the pandemic and arguably near its average trading level since 1990.
The efficient market is seeing
heightened capital expenditures by corporations, positive earnings strength,
healthy bank balance sheets and a consumer poised to accelerate spending, hence
a very low VIX reading. The markets are quiet but
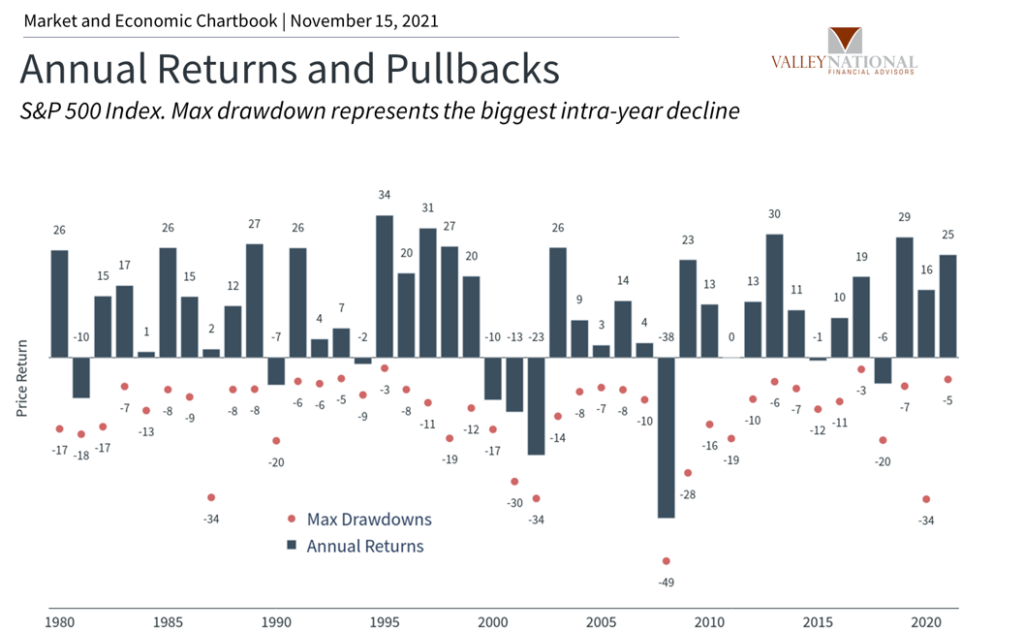
are they too quiet? Remember, pull-backs happen in every bull market, and
we believe pullbacks are healthy for functioning markets. See the chart
below from Clearnomics and
Valley National Financial Advisors showing
the performance of the stock market each year (bars) and the largest intra-year
decline (dots) each year. The average drop in any year is -13.5% but the
long-term average of the market is +9.0% each year, regardless of the
pullbacks.
Markets are efficient and
volatility is a normal part of investing. The smart investor is rewarded
for staying disciplined and remaining invested, especially during times of
short-term market volatility.
In the United States, the CDC
announced that anyone over age 18 can receive a COVID-19 booster shot. This
good news comes on the heels of rising Covid-19 cases in parts of Europe. Austria,
for example, initiated a national lockdown and Germany said it may consider the
same as new cases continued to surge. Certainly, rising COVID-19 cases
anywhere, but specifically in the EU or U.S., will weigh heavily on the
financial markets and will need to be monitored closely. This week is a
shortened holiday week with the markets closed for Thanksgiving on Thursday and
an early close on Friday. Watch for Wednesday’s economic releases
including 3Q GDP, U.S. Federal Reserve Meeting Minutes, and weekly unemployment
claims – all which could give signals to market movements through year-end and
into 2022.
THE NUMBERS Sources: Index Returns: Morningstar Workstation. Past performance is no guarantee of future results. Indices are unmanaged and cannot be invested into directly. Three, five and ten year returns are annualized. Interest Rates: Federal Reserve, Mortgage Bankers Association.
MARKET HEAT MAP
The health of the economy is a key driver of long-term returns in the stock market. Below, we assess the key economic conditions that we believe are of particular importance to investors.
US ECONOMY
CONSUMER HEALTH
POSITIVE
U.S. GDP growth decelerated to a 2% annualized pace in Q3. The slowdown was driven primarily by supply chain constraints. Economists expect a modest acceleration in Q4.
CORPORATE EARNINGS
POSITIVE
With 95% of S&P 500 companies having reported Q3 results, sales and earnings are up 17.5% and 39%, respectively. However, company commentary suggests that the supply chain has been and will continue to be problematic in the coming quarters.
EMPLOYMENT
POSITIVE
The unemployment rate is down to 4.6%, as of October. The labor market is very tight at present as many employers, particularly in the Leisure and Logistics sectors, are struggling to fully staff because the labor participation rate remains below pre-COVID levels. The labor shortage is one of the causes of the global supply chain glut.
INFLATION
NEUTRAL
CPI rose 6.2% year-over-year in October, the highest increase since 1990, driven by the global supply chain backlog. Will inflation be transitory or permanent?
FISCAL POLICY
POSITIVE
A $1.2 trillion infrastructure bill was passed by Congress. $1.75 trillion spending bill passed by Congress and also sent to Senate for revisions.
MONETARY POLICY
POSITIVE
The Fed will begin bond tapering by November’s end. By mid-2022, all Fed bond purchases will halt. The Fed’s bong buying program works to keep interest rates low. Inflation concerns are persisting, and some are calling for faster tapering and high rates.
GLOBAL CONSIDERATIONS
GEOPOLITICAL RISKS
NEUTRAL
COVID-19 cases are surging in parts of EU (Austria and Germany) leading to further lockdowns.
ECONOMIC RISKS
NEUTRAL
Supply chain disruptions are hampering the economy; however, demand remains very strong. While global logistics are operating far below normal efficacy, it appears the supply chain is slowly improving and may reach normalcy by mid-to-late-2022.
The “Heat Map” is a subjective analysis based upon metrics that VNFA’s investment committee believes are important to financial markets and the economy. The “Heat Map” is designed for informational purposes only and is not intended for use as a basis for investment decisions.