
THE NUMBERS
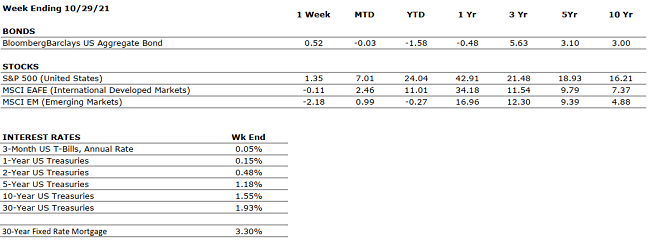 Sources: Index Returns: Morningstar Workstation. Past performance is no guarantee of future results. Indices are unmanaged and cannot be invested into directly. Three, five and ten year returns are annualized. Interest Rates: Federal Reserve, Mortgage Bankers Association.
MARKET HEAT MAP
The health of the economy is a key driver of long-term returns in the stock market. Below, we assess the key economic conditions that we believe are of particular importance to investors.
|
US ECONOMY |
||
|
CONSUMER HEALTH |
POSITIVE |
U.S. GDP growth decelerated to a 2% annualized pace in Q3. The slowdown was driven primarily by supply chain constraints. Economists expect a modest acceleration in Q4. |
|
CORPORATE EARNINGS |
POSITIVE |
With 55% of S&P 500 companies having reported Q3 results, sales and earnings are up 15.5% and 26.5%, respectively. However, company commentary suggests that the supply chain has been and will continue to be problematic in the coming quarters. |
|
EMPLOYMENT |
POSITIVE |
The unemployment rate is down to 4.8%, as of September. The labor market is very tight at present, as many employers, particularly in the Leisure and Logistics sectors, are struggling to fully staff. The labor shortage is one of the causes of the global supply chain glut. |
|
INFLATION |
NEUTRAL |
CPI rose 5.4% year-over-year in September, driven by the global supply chain backlog. |
|
FISCAL POLICY |
POSITIVE |
A bill to lift the U.S. debt ceiling by $480 billion – which should provide enough headroom for government operations until December 3 – was passed. |
|
MONETARY POLICY |
POSITIVE |
In recent communications, the Fed has indicated bond tapering may begin by the end of 2021 while rate hikes could commence by the end of 2022. Nonetheless, monetary policy remains relatively accommodative with rates at historical lows. |
|
GLOBAL CONSIDERATIONS |
||
|
GEOPOLITICAL RISKS |
NEUTRAL |
Although the Taliban’s control in Afghanistan is concerning, it is unlikely to have a meaningful economic impact. |
|
ECONOMIC RISKS |
NEUTRAL |
Supply chain disruptions are hampering the economy; however, demand remains very strong. The hold-ups should ease progressively over time. |
The “Heat Map” is a subjective analysis based upon metrics that VNFA’s investment committee believes are important to financial markets and the economy. The “Heat Map” is designed for informational purposes only and is not intended for use as a basis for investment decisions.