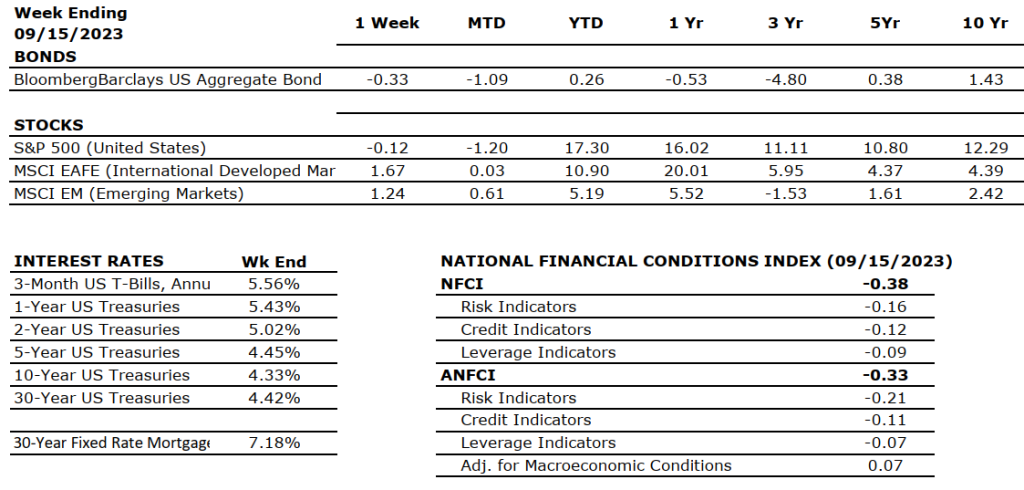
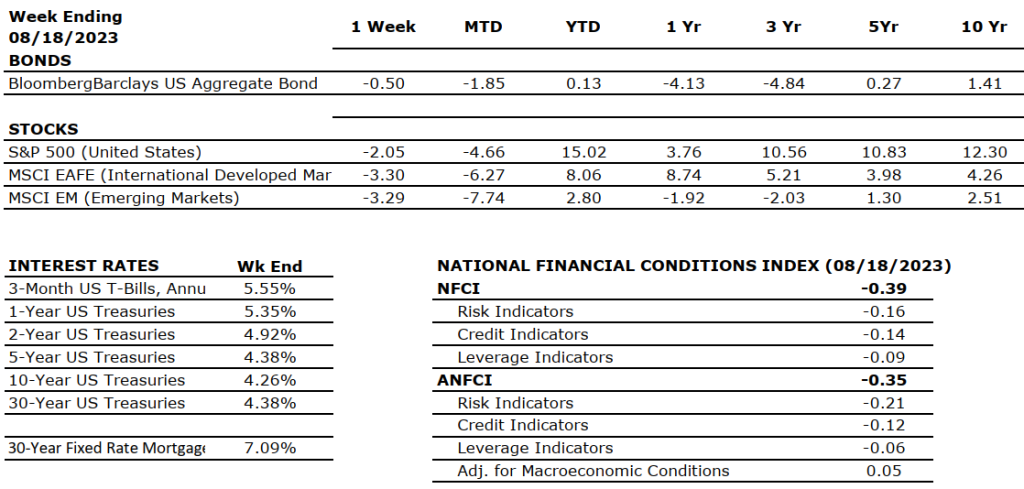
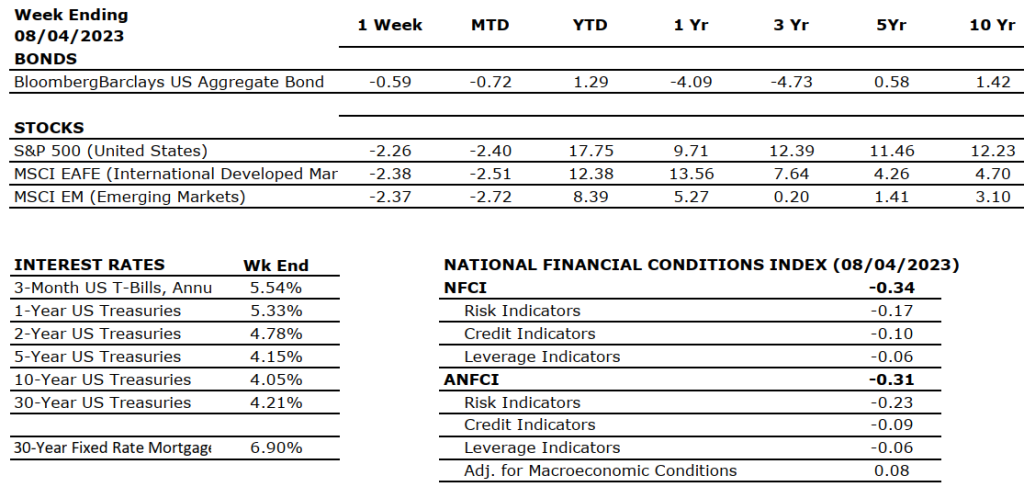
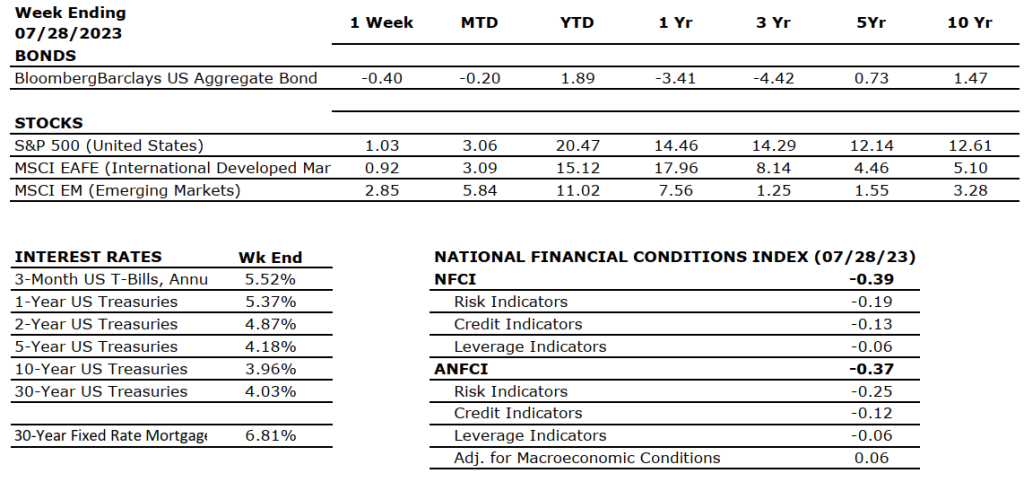
Sources: Index Returns: Morningstar Workstation. Past performance is no guarantee of future results. Indices are unmanaged and cannot be invested into directly. Three, five- and 10- yearreturns are annualized excluding dividends.Interest Rates: Federal Reserve, Mortgage Bankers Association.
MARKET HEAT MAP
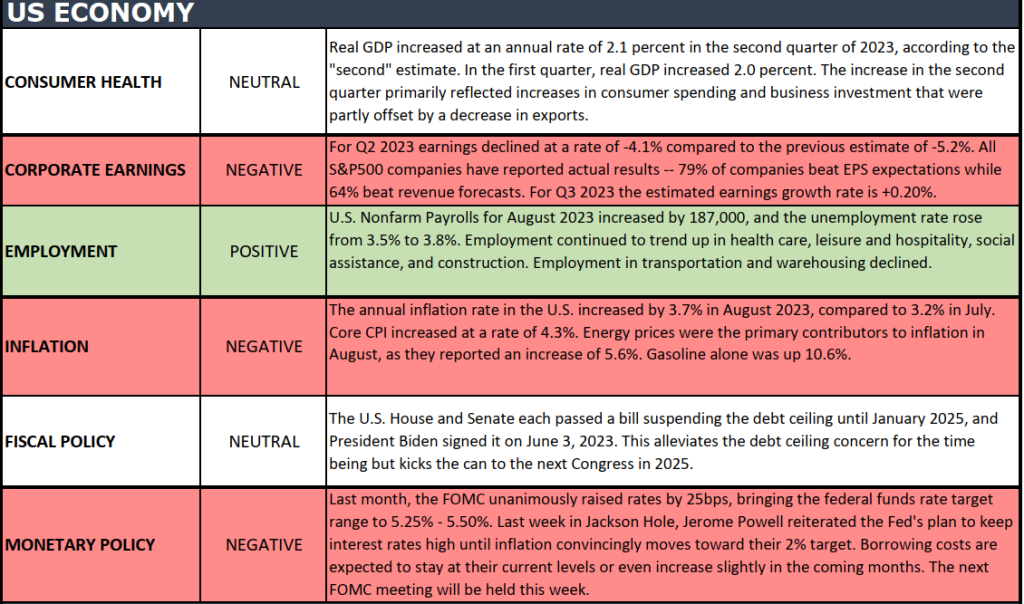
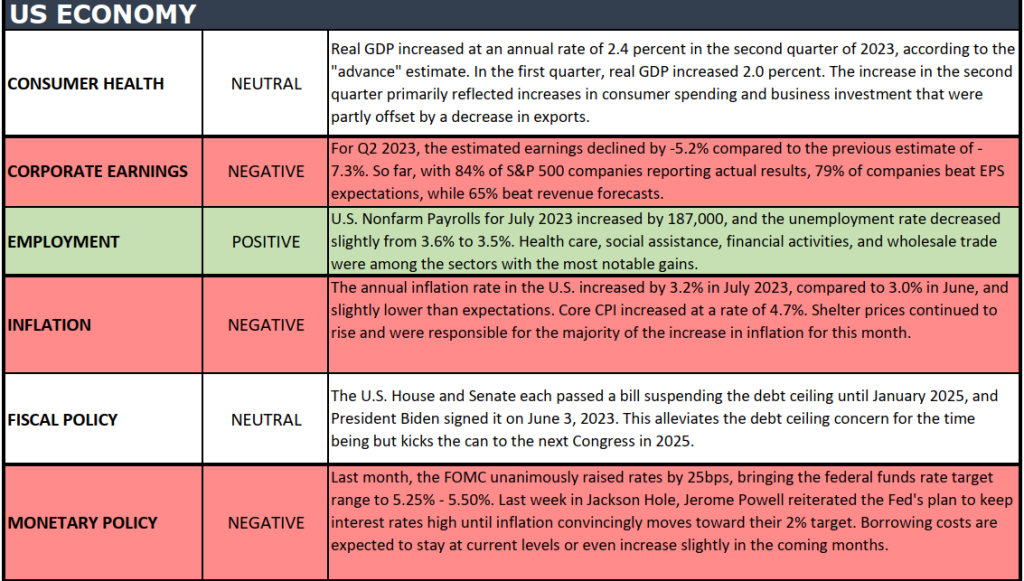
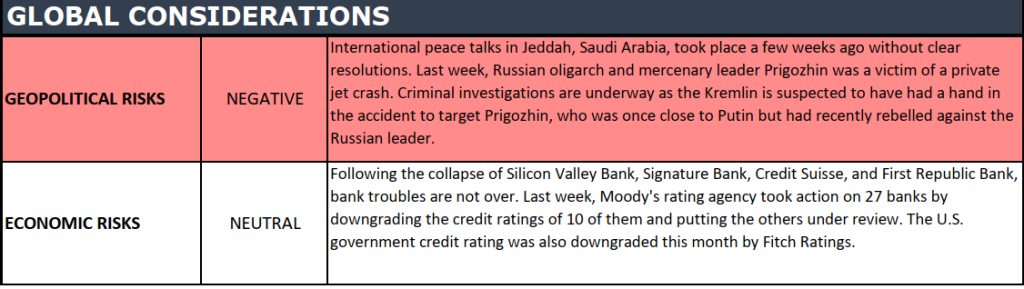
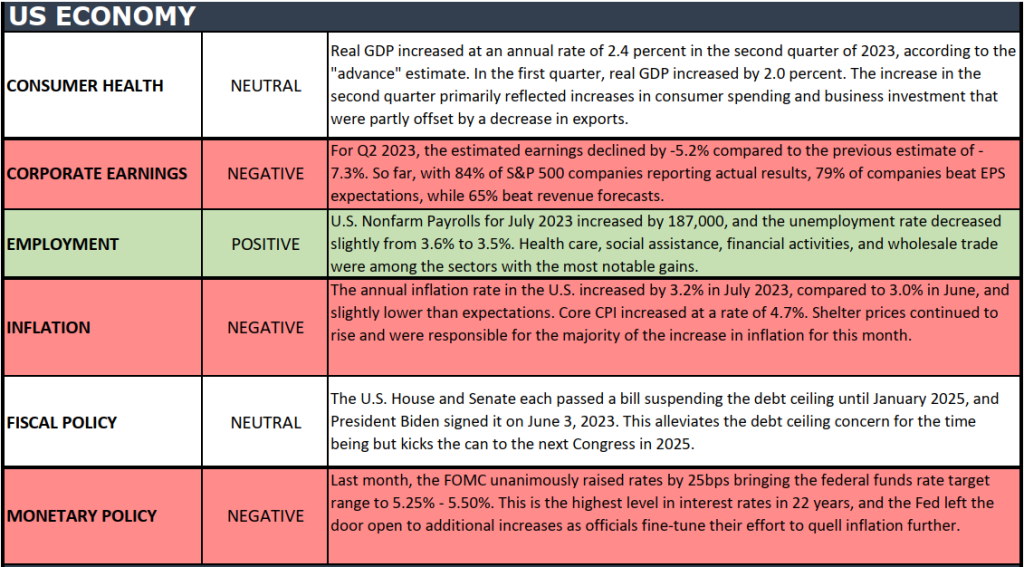
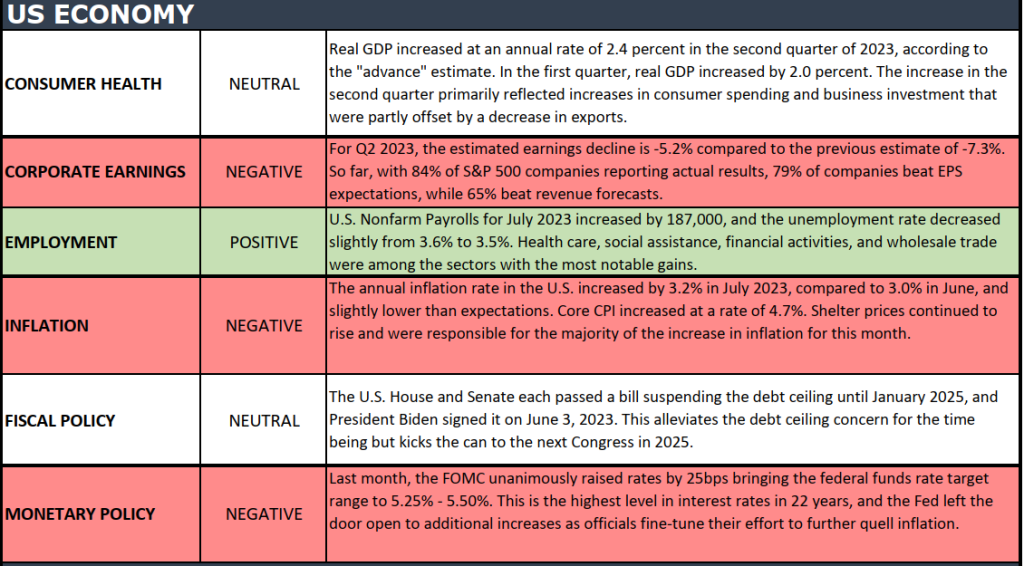
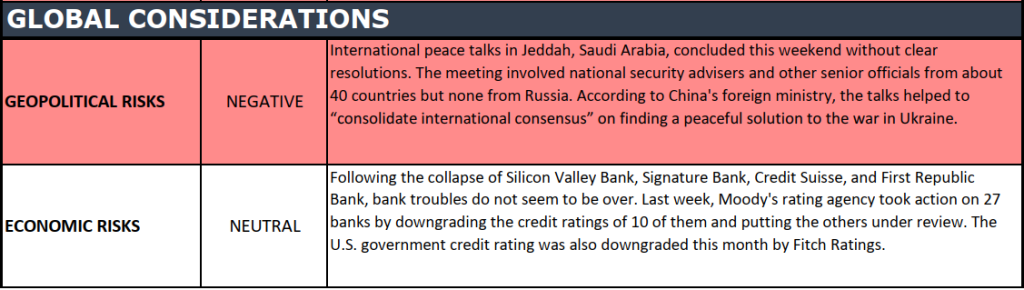
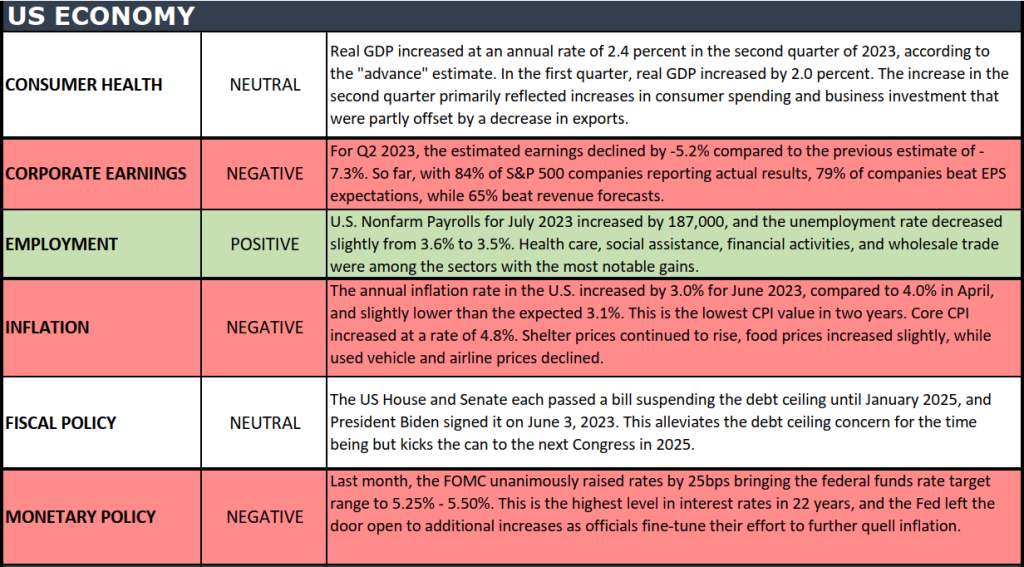
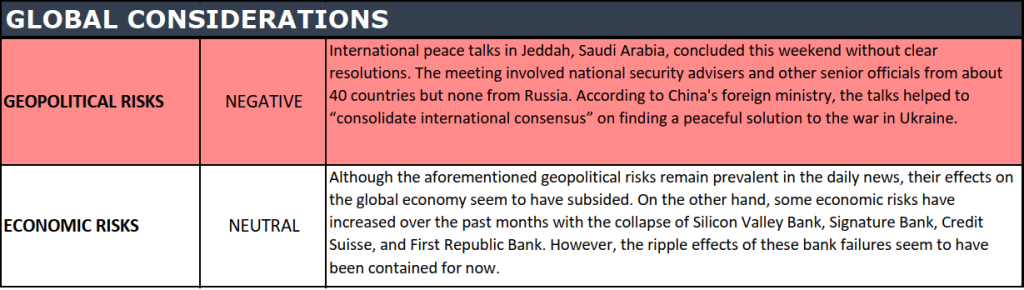
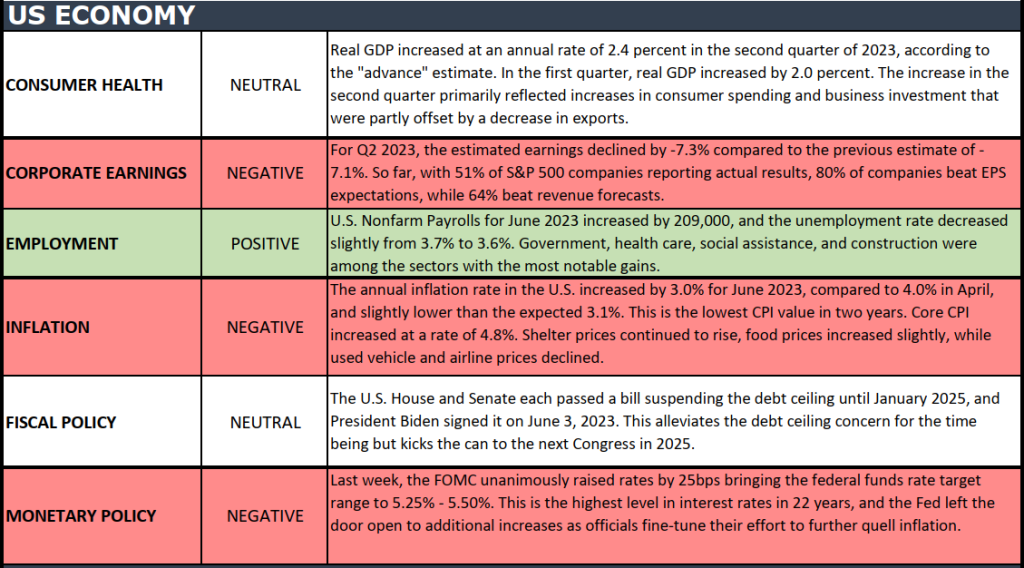
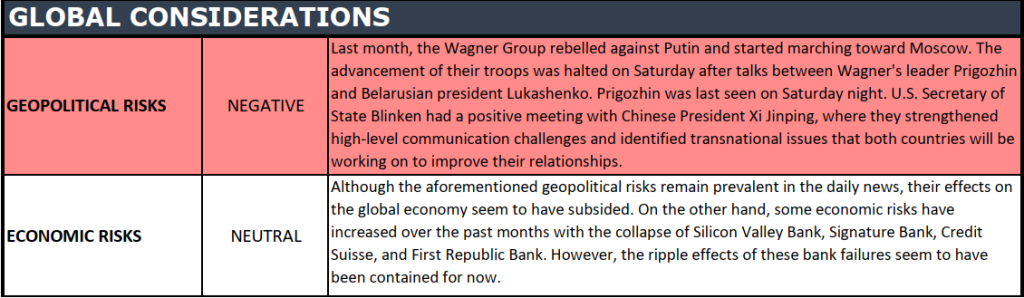
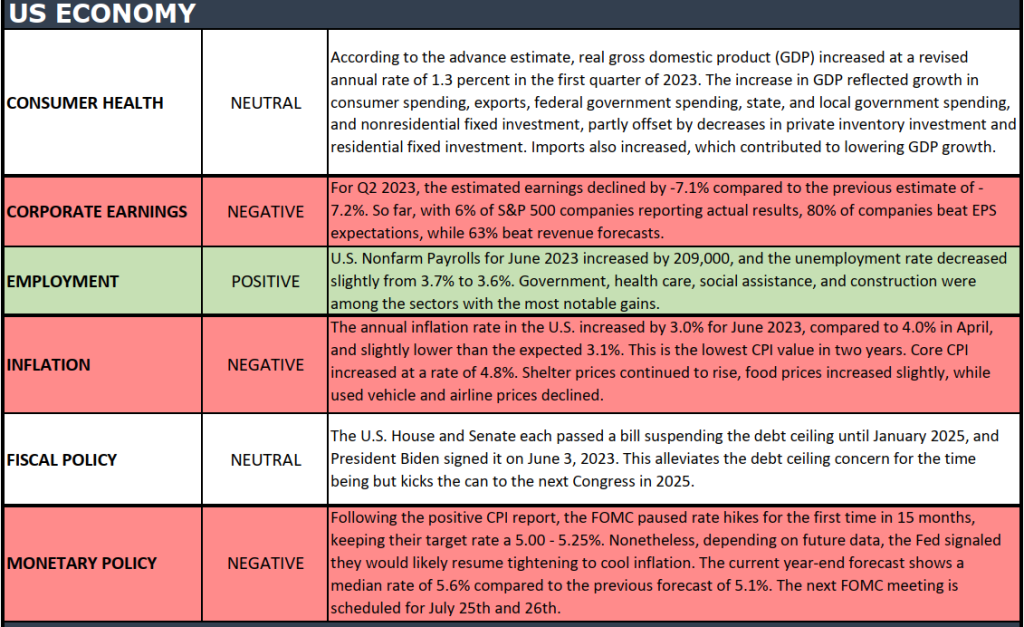
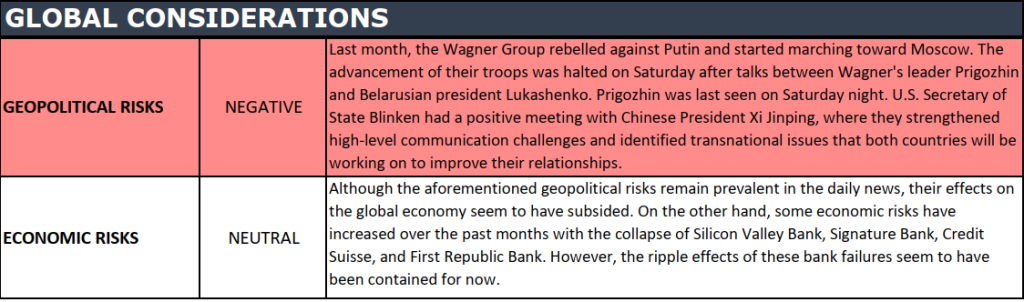
The health of the U.S. economy is a key driver of long-term returns in the stock market. Below, we grade key economic conditions that we believe are of particular importance to investors.
The “Heat Map” is a subjective analysis based upon metrics that VNFA’s investment committee believes are important to financial markets and the economy. The “Heat Map” is designed for informational purposes only and is not intended for use as a basis for investment decisions.
Sources: Index Returns: Morningstar Workstation. Past performance is no guarantee of future results. Indices are unmanaged and cannot be invested into directly. Three, five- and 10- yearreturns are annualized excluding dividends.Interest Rates: Federal Reserve, Mortgage Bankers Association.
MARKET HEAT MAP
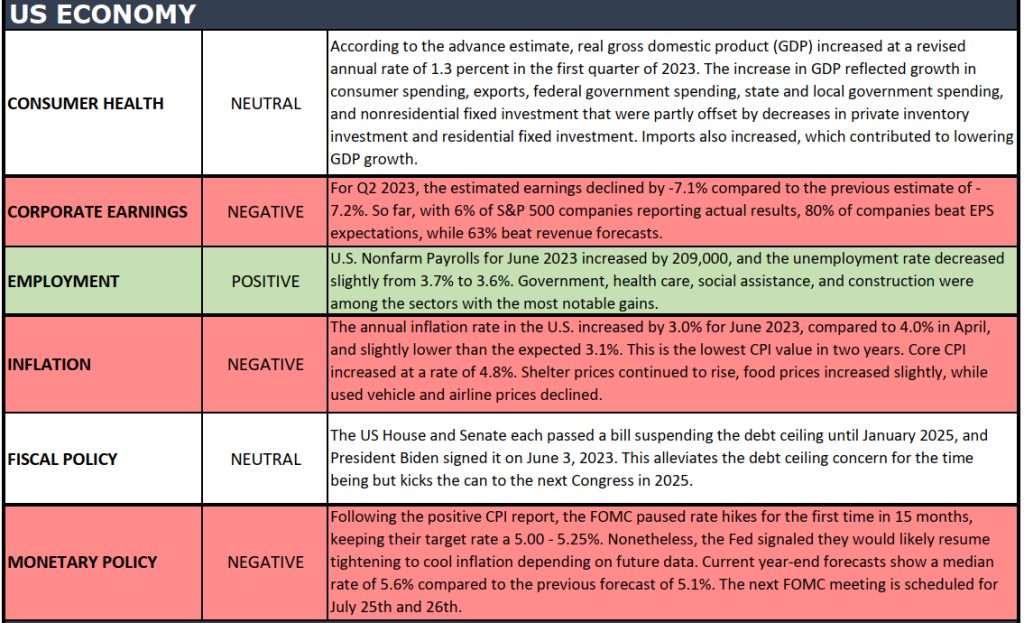
The health of the U.S. economy is a key driver of long-term returns in the stock market. Below, we grade key economic conditions that we believe are of particular importance to investors.
The “Heat Map” is a subjective analysis based upon metrics that VNFA’s investment committee believes are important to financial markets and the economy. The “Heat Map” is designed for informational purposes only and is not intended for use as a basis for investment decisions.
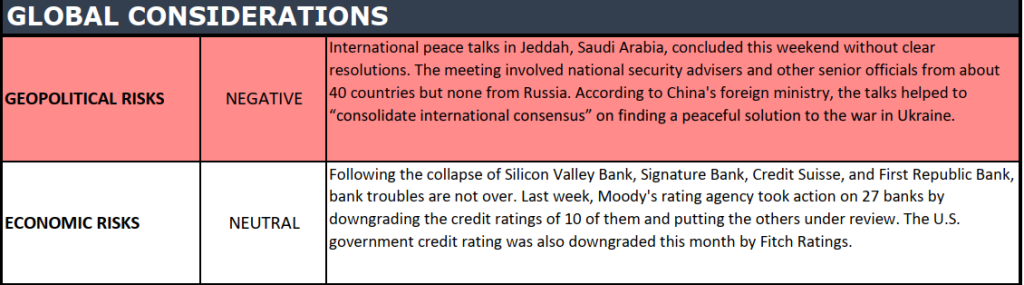
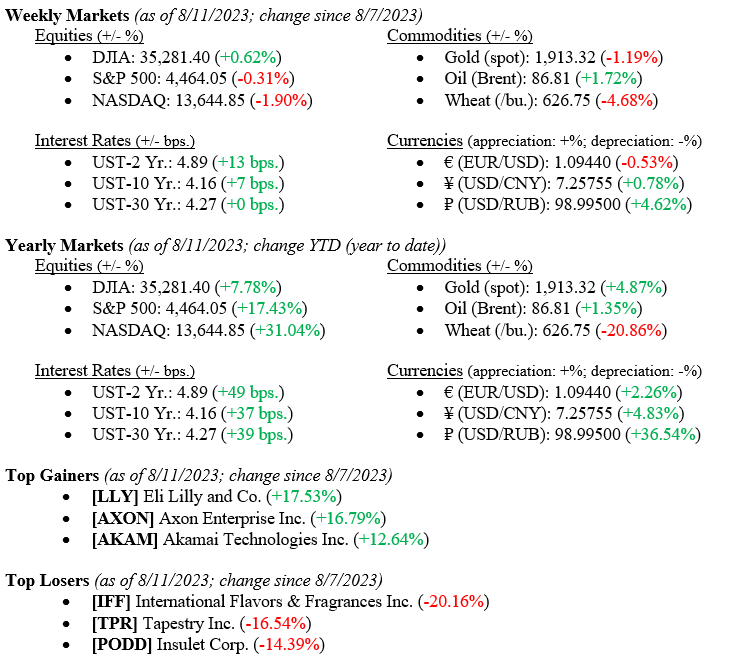
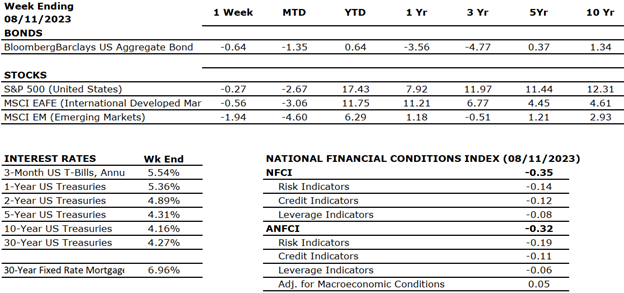
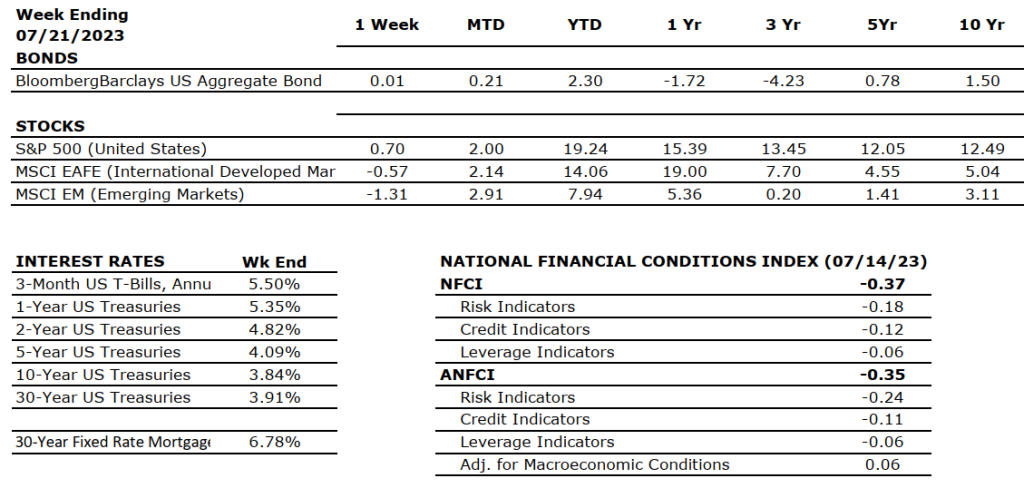
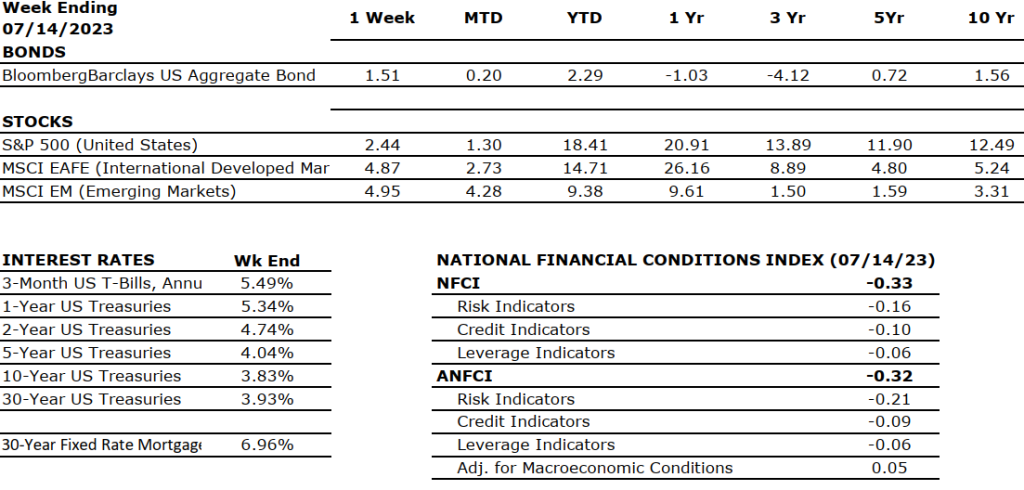
Markets ended last week mostly flat, with the Dow Jones Industrial average netting a 0.62% gain, while the S&P500 and NASDAQ lost 0.31% and 1.90%, respectively. Year-to-date returns on all three major indexes remain well in positive territory (see details below). In terms of economic data released last week, the Producer Price Index (PPI) increased month-over-month and year-over-year, which means it is still contributing to inflation despite it slowing considerably. While the Fed is waiting for solid economic data before announcing they won the inflation war, American Consumer’s inflation expectations are declining. The current inflation expectation rate is just 3.3% overall over the next year versus the 3.4% figure that was anticipated in July. Interest rates continued to increase last week, with the 10-year U.S. Treasury increasing seven basis points to end the week at 4.16%.
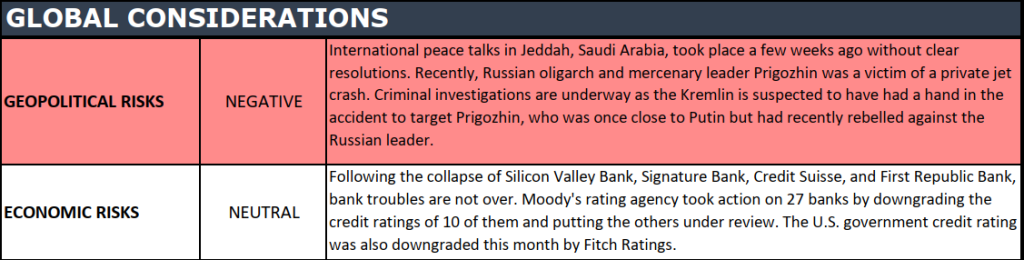
Global Economy
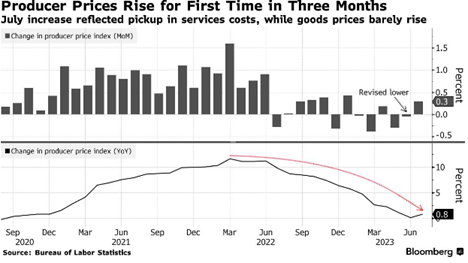
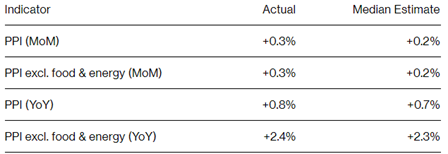
U.S. Producer Prices increased in July due to rises in service categories, underscoring the challenges in managing inflation. The Producer Price Index for final demand and the core index, excluding food and energy, rose by 0.3% in July, slightly surpassing predictions. Factors like stabilizing supply chains, limited overseas demand, and shifting consumer spending towards services have eased producer-level inflation. However, recent oil price hikes are reintroducing inflationary pressures. Inflation in healthcare services accelerated, impacting key inflation measures. Recent consumer price data indicating minimal gains might deter the Federal Reserve Bank from raising interest rates in September. The Core PPI, which excludes volatile components like food and energy, increased only 0.3% in July and 2.4% annually, which is getting close to the Fed’s target rate of 2.00%. See the detailed charts below from Bloomberg.
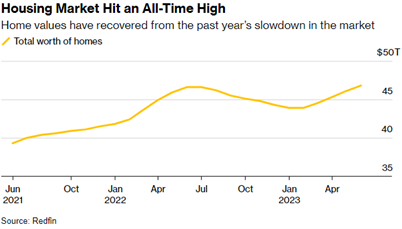
The U.S. housing market has rebounded, recovering nearly $3 trillion in lost value from the previous year’s slowdown. A continued shortage of listings has driven up prices and elevated the total worth of U.S. homes to a record $47 trillion, as reported by Redfin Corp, see Chart 2 below from Redfin. The reluctance of homeowners to relinquish their lower-rate mortgages amid rising borrowing costs has resulted in only 1% of U.S. homes changing ownership this year, the lowest figure in a decade.
Policy and Politics
During the upcoming BRICS (Brazil, Russia, India, China, & South Africa) economic summit in South Africa, discussions will revolve around increasing the utilization of local currencies for trade among member states, including establishing a common payments system and potentially forming a technical committee to explore the concept of a joint currency. The focus is not on replacing the U.S. dollar as the global currency but rather on enhancing the use of domestic currencies to foster trade and counterbalance the dominance of the U.S. This is important to us to watch as some BRICS countries are part of the major move in U.S. manufacturing around nearshoring (moving offshore manufacturing physically closer to U.S. headquarters) and friend-shoring (moving offshore manufacturing to trade partners deemed more “business friendly”) since the massive supply chain disruptions that were seen during the pandemic.
What to Watch
Monday, August 14th
U.S. Retail Gas Price at 4:30PM (Prior: $3.94/gal.)
Wednesday, August 16th
U.S. Housing Starts / MoM at 8:30AM (Priors: 1.434M / -8.02%)
U.S. Job Openings: Total Nonfarm at 10:00AM (Prior: 9.582M)
Thursday, August 17th
U.S. Initial Claims for Unemployment Insurance at 8:30AM (Prior: 248k)
30 Year Mortgage Rate at 12:00PM (Prior: 6.96%)
As is typical in August, markets reach a calm/quiet period as Washington, DC, is on vacation with much of the rest of the country and world. Federal Chairman Jay Powell has slowly crafted his economic soft landing (battling inflation with higher interest rates and not sending the economy into a recession). However, the war is ongoing as inflation is still above the 2% target (U.S. Inflation Rate for July 2023 was 3.18%). As noted above, equity markets have slowly increased year-to-date, reflecting strong economic conditions, healthy labor and housing markets, and resilient consumers. Our mantra remains that investors can be cautiously optimistic for the remaining part of 2023.
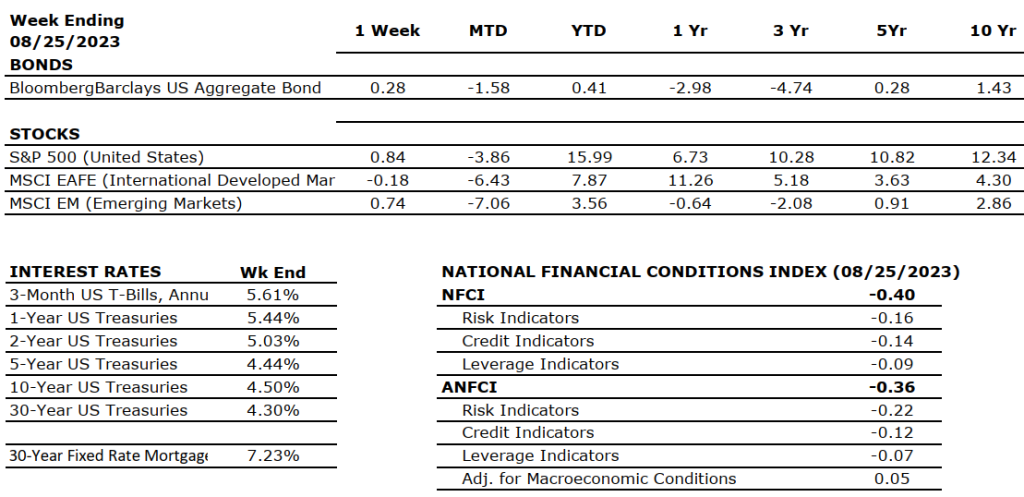
Sources: Index Returns: Morningstar Workstation. Past performance is no guarantee of future results. Indices are unmanaged and cannot be invested into directly. Three, five- and 10- yearreturns are annualized excluding dividends.Interest Rates: Federal Reserve, Mortgage Bankers Association.
MARKET HEAT MAP
The health of the U.S. economy is a key driver of long-term returns in the stock market. Below, we grade key economic conditions that we believe are of particular importance to investors.
The “Heat Map” is a subjective analysis based upon metrics that VNFA’s investment committee believes are important to financial markets and the economy. The “Heat Map” is designed for informational purposes only and is not intended for use as a basis for investment decisions.