Lehigh Valley Business selected VNFA for “Behind the List” this week. Accompanying the list of Asset Managers & Investment Brokerage Firms is an interview with our CEO, Matt Petrozelli.
Daily Archives: October 9, 2018
The Numbers & “Heat Map”
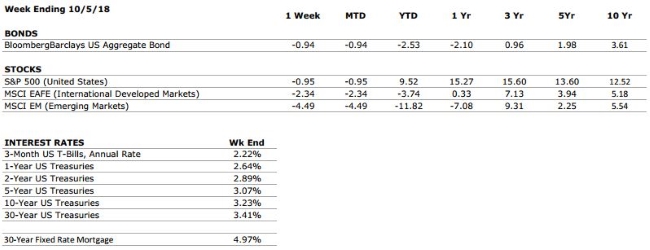
THE NUMBERS
Sources: Index Returns: Morningstar Workstation. Past performance is no guarantee of future results. Indices are unmanaged and cannot be invested into directly. Three, five and ten year returns are annualized excluding dividends. Interest Rates: Federal Reserve, Freddie Mac
US ECONOMIC HEAT MAP
The health of the US economy is a key driver of long-term returns in the stock market. Below, we grade 5 key economic conditions that we believe are of particular importance to investors.
|
CONSUMER SPENDING |
A+ |
Consumer spending is expected to remain healthy as individuals with lower tax rates spend their windfalls. |
|
FED POLICIES |
C- |
In September, the Federal Reserve raised interest rates for the third time this year. Rising interest rates tend to reduce economic growth potential and can lead to repricing of income producing assets. |
|
BUSINESS PROFITABILITY |
A |
Factset is reporting a blended earnings growth rate of 20% YoY for the 2nd quarter of 2018. Tax reform has played a major role, but the strength of the US consumer is boosting corporate profits as well. We will get our first glimpse of Q3 earnings over the next few weeks. |
|
EMPLOYMENT |
A+ |
The US economy added 201,000 new jobs in August and the unemployment rate remained below 4%. Additionally, weekly jobless claims fell to their lowest level in over 50 years last week. The job market remains very healthy. |
|
INFLATION |
B |
Inflation is often a sign of “tightening” in the economy, and can be a signal that growth is peaking. The inflation rate remains benign at this time, but we see the potential for an increase moving forward. This metric deserves our attention. |
|
OTHER CONCERNS |
||
|
INTERNATIONAL RISKS |
5 |
The above ratings assume no international crisis. On a scale of 1 to 10 with 10 being the highest level of crisis, we rate these international risks collectively as a 5. These risks deserve our ongoing attention. |
The “Heat Map” is a subjective analysis based upon metrics that VNFA’s investment committee believes are important to financial markets and the economy. The “Heat Map” is designed for informational purposes only and is not intended for use as a basis for investment decisions.
FROM THE PROS… VIDEO
 Senior Vice President Laurie Siebert, CPA, CFP®, AEP® introduces a video series that will reveal her five-step approach to crafting an estate plan. WATCH NOW
You can subscribe to our YouTube channel to get notifications when the next video in the series is available.
Quote of the Week
“Do not regret growing older. It is a privilege denied to many.” – Unknown
The Markets This Week
by Connor Darrell, Head of Investments
Stocks and bonds both fell last week as interest rates moved markedly higher. The yield on the 10-Year Treasury note jumped to its highest level since 2011, and now sits at 3.23%. Interestingly, it seemed that the market movements were sparked by a “good news is bad news” type scenario, where Fed Chair Jerome Powell’s comments that the economy is “firing on all cylinders” prompted concerns of an acceleration in the tightening of monetary policy.
Rising Rates are Nothing to Fear
The activity in markets last week was a microcosm of what many market strategists have feared a rising interest rate environment might create; a period of pressure on both stocks and bonds, where both asset classes struggle to generate positive returns and leave investors with nowhere to “hide”. While it is true that rising interest rates may represent headwinds in both stock and bond markets, we believe there is an emerging opportunity to utilize short-term instruments in a way that has not been available to investors in a very long time. If rate increases continue on the schedule that seems to have been hinted at by the Federal Reserve (which has thus far been very effective at telegraphing its future policy changes), the yields available to short-term fixed income investors could be safely north of 3.5% by the end of next year. At these levels, short-term fixed income can provide stability in a portfolio while still preserving an investor’s spending power.
Bond investors should be further comforted by the fact that the yield curve has begun to steepen again. Historically, an inversion of the yield curve (which occurs when short-term rates move higher than long-term rates) has been a bearish signal for the economy and for markets. However, the yield movements we have observed recently suggest that the probability of yield curve inversion has declined. Investors have not had to grapple with a rising rate environment for quite some time and volatility should be expected moving forward as a result. But there are still reasons to remain optimistic about the forward outlook, and there are tools investors can utilize to help insulate their portfolios from any bumps along the way.
“Your Financial Choices”
The show airs on WDIY Wednesday evenings, from 6-7 p.m. The show is hosted by Valley National’s Laurie Siebert CPA, CFP®, AEP®. This week Laurie will discuss: “Charitable Giving in a new tax environment.”
Laurie will take your calls on this or other topics at 610-758-8810 during the live show, or via yourfinancialchoices.com. Recordings of past shows are available to listen or download at both yourfinancialchoices.com and wdiy.org.
