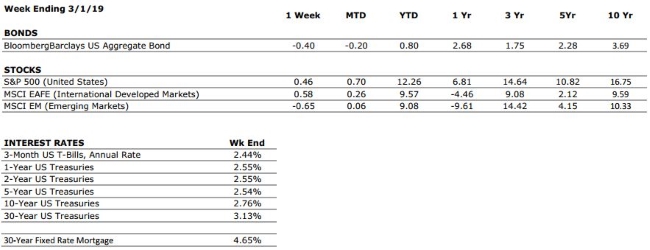
The Numbers & “Heat Map”

THE NUMBERS
Sources: Index Returns: Morningstar Workstation. Past performance is no guarantee of future results. Indices are unmanaged and cannot be invested into directly. Three, five and ten year returns are annualized excluding dividends. Interest Rates: Federal Reserve, Freddie Mac

US ECONOMIC HEAT MAP
The health of the US economy is a key driver of long-term returns in the stock market. Below, we grade 5 key economic conditions that we believe are of particular importance to investors.

CONSUMER SPENDING

A

We have downgraded our consumer spending grade to A from A+ following weaker than expected December retail sales data and some declines in consumer confidence surveys. However, monthly data can be volatile and we still believe that the US consumer is in a healthy position.

FED POLICIES

C-

The Federal Reserve implemented four interest rate hikes during 2018, and while the rate hike cycle appears to be on pause for now, rising interest rates tend to reduce economic growth potential and can lead to repricing of income producing assets.

BUSINESS PROFITABILITY

B+

Corporate earnings remain strong, but we anticipate earnings growth will taper off in 2019. We are also beginning to see a higher number of companies reducing forward earnings guidance, a sign that earnings growth may have reached its peak in 2018.

EMPLOYMENT

A

The US economy added just 20,000 new jobs in February, which was far less than expected. This was the weakest number since 2017, but job gains from both December and January were revised upwards. Despite the weak report, the labor market remains one of the strongest components of the economic backdrop at this time.

INFLATION

B

Inflation is often a sign of “tightening” in the economy, and can be a signal that growth is peaking. The inflation rate remains benign at this time, but we see the potential for an increase moving forward. This metric deserves our attention.

OTHER CONCERNS

INTERNATIONAL RISKS

5

The above ratings assume no international crisis. On a scale of 1 to 10 with 10 being the highest level of crisis, we rate these international risks collectively as a 5. These risks deserve our ongoing attention.

The “Heat Map” is a subjective analysis based upon metrics that VNFA’s investment committee believes are important to financial markets and the economy. The “Heat Map” is designed for informational purposes only and is not intended for use as a basis for investment decisions.

The Markets This Week

by Connor Darrell CFA, Assistant Vice President – Head of Investments
The major global equity indexes posted their worst week of the year as investor sentiment was impacted by further evidence of a slowdown in global economic activity. In the U.S., the monthly jobs number came in far lower than expected, though there is reason to believe that the report was heavily influenced by weather-related factors. In Europe, the European Central Bank (ECB) announced that it intended to inject further liquidity into the European banking system in an effort to curtail the negative impact that trade tensions and geopolitical concerns have had on economic growth. Lastly, the Chinese government seemed to unsettle markets when it announced a new fiscal stimulus program aimed at increasing activity in its slowing manufacturing sector. Bonds climbed higher as rates fell amid the flurry of new economic data and policy developments. 

The Pendulum Continues to Swing
At the beginning of December, the S&P 500 was trading right around the 2,790 level before negative sentiment drove the index to the brink of bear market territory. After a sharp reversal around Christmas and one of the strongest starts to a year in decades, the turmoil from December felt like a faded memory. But last week brought with it five consecutive days of negative returns for equity markets, leaving many investors wondering where we go from here 

It’s important to remember that market performance tends to track earnings over the long-term, and earnings are largely driven by economic fundamentals. The fact is that economic fundamentals simply do not reverse course so significantly in such a short period of time. As such, it makes sense to inquire as to whether the market was too pessimistic during December or too optimistic during January and February? The answer is probably yes on both fronts.

Given the heightened uncertainty and slower growth rates being observed around the globe (as compared to 2017 levels), the current fair value for the market is likely somewhere in between December’s bottom and March’s peak. The market seems to have attributed much of the recent slowdown in China to continuing trade tensions with the United States, while in Europe, the uncertainty of the Brexit situation continues to impact business investment and economic activity. Clarity on both of these issues is likely to be provided before the end of 2019, and this may allow economic growth to reaccelerate by the second half of the year. But until then, the pendulum may keep swinging back and forth with markets stuck in a bounded trading range. For investors, this is a period where patience and discipline will be essential. We continue to favor a disciplined approach to tactical rebalancing rather than attempting to time entry and exit points.

“Your Financial Choices”

The show airs on WDIY Wednesday evenings, from 6-7 p.m. The show is hosted by Valley National’s Laurie Siebert CPA, CFP®, AEP®.

This week, Laurie and her guest Mae Gerhart, Tax Accountant / Financial Planning Professional  at Valley National Financial Advisors will address:  “MORE Tax Questions from Listeners”

Laurie will take your calls on this or other topics at 610-758-8810 during the live show, or via yourfinancialchoices.com.

Recordings of past shows – including last month’s Tax Questions from Listeners (Feb. 13) – are available to listen or download  at both yourfinancialchoices.com and wdiy.org.

Valley National News

Happy Anniversary WDIY!
WDIY celebrated 24 years on the air with the volunteers, staff, community and listener supporters at the Ice House in Bethlehem. Valley National Financial Advisors is proud to support Lehigh Valley public radio, and to bring listeners “Your Financial Choices” on WDIY, Wednesdays from 6-7p.m. with Laurie Siebert.

The Numbers & “Heat Map”

THE NUMBERS
Sources: Index Returns: Morningstar Workstation. Past performance is no guarantee of future results. Indices are unmanaged and cannot be invested into directly. Three, five and ten year returns are annualized excluding dividends. Interest Rates: Federal Reserve, Freddie Mac

US ECONOMIC HEAT MAP
The health of the US economy is a key driver of long-term returns in the stock market. Below, we grade 5 key economic conditions that we believe are of particular importance to investors.

CONSUMER SPENDING

A

We have downgraded our consumer spending grade to A from A+ following weaker than expected December retail sales data and some declines in consumer confidence surveys. However, monthly data can be volatile and we still believe that the US consumer is in a healthy position.

FED POLICIES

C-

The Federal Reserve implemented four interest rate hikes during 2018, and while the rate hike cycle appears to be on pause for now, rising interest rates tend to reduce economic growth potential and can lead to repricing of income producing assets.

BUSINESS PROFITABILITY

B+

Corporate earnings remain strong, but we anticipate earnings growth will taper off in 2019. We are also beginning to see a higher number of companies reducing forward earnings guidance, a sign that earnings growth may have reached its peak in 2018.

EMPLOYMENT

A+

The US economy added 304,000 new jobs in January, soundly beating estimates for the second straight month. The labor market is one of the strongest components of the economic backdrop at this time.

INFLATION

B

Inflation is often a sign of “tightening” in the economy, and can be a signal that growth is peaking. The inflation rate remains benign at this time, but we see the potential for an increase moving forward. This metric deserves our attention.

OTHER CONCERNS

INTERNATIONAL RISKS

5

The above ratings assume no international crisis. On a scale of 1 to 10 with 10 being the highest level of crisis, we rate these international risks collectively as a 5. These risks deserve our ongoing attention.

The “Heat Map” is a subjective analysis based upon metrics that VNFA’s investment committee believes are important to financial markets and the economy. The “Heat Map” is designed for informational purposes only and is not intended for use as a basis for investment decisions.

The Markets This Week

by Connor Darrell CFA, Assistant Vice President – Head of Investments
Perceived progress in the ongoing trade negotiations between the U.S. and China seemed to keep an aura of optimism around equity trading last week, with developed markets equities (as measured by the S&P 500 and the MSCI EAFE indexes) inching higher. Bond yields also moved higher, with the 10-Year Treasury yield reaching its highest level in a month.

After a long delay related to the government shutdown, Q4 U.S. GDP was reported last week. The data showed that the U.S. economy grew 2.6%, which was above expectations but still below the trend rate that had been in place for the past two quarters. On the whole, the economy grew at a rate of 2.9% during 2018, up from 2.2% in 2017. 

Market Performance Diverging from Economic Data
The S&P 500 has posted its best two-month start to a year since 1991, even as economic data and corporate earnings have begun to taper off. While not necessarily poor in absolute terms, recently released economic data has been disappointing, with housing starts falling to their lowest level in two years and consumer spending declining precipitously. In the near-term, it is difficult to evaluate to what extent the uncertainty stemming from the government shutdown can be blamed, but thus far the Fed’s reaction (which has been to suggest that patience may be warranted in determining the path of future policy) has been celebrated by markets. 

It is likely not a coincidence that the market’s strong start to the year has coincided with a change in tone from the Fed. The expectation in the market is now for the Fed to hold pat for the entirety of 2019, which if recent trends are to be believed, would likely bode well for stocks. But as we observed during the latter half of 2018, sentiment can change very quickly.