THE NUMBERS

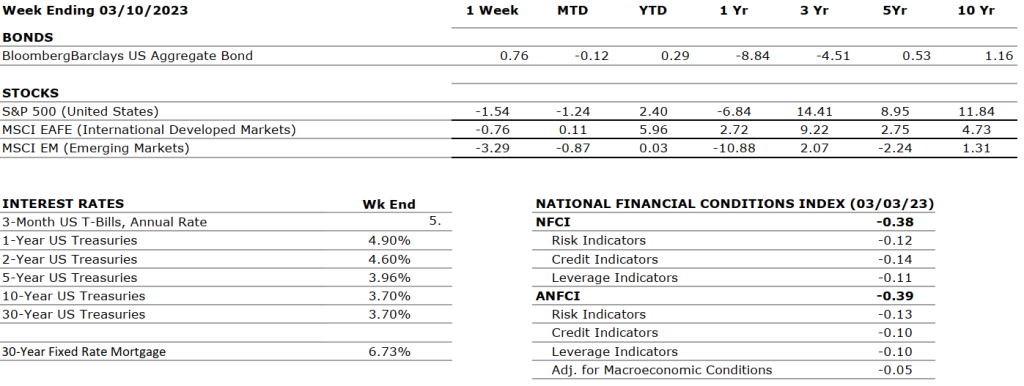
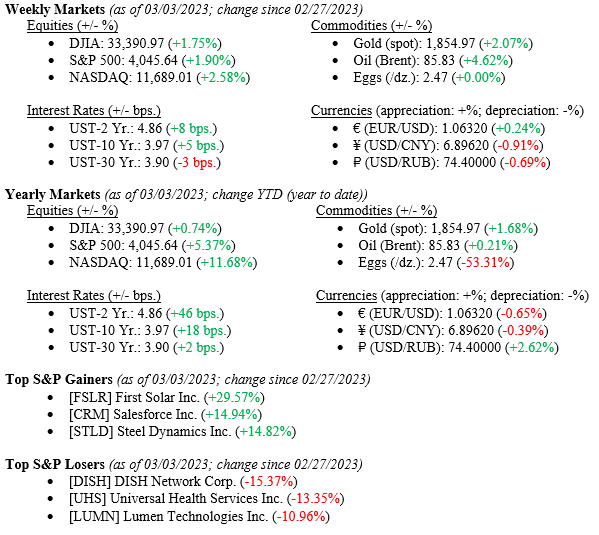
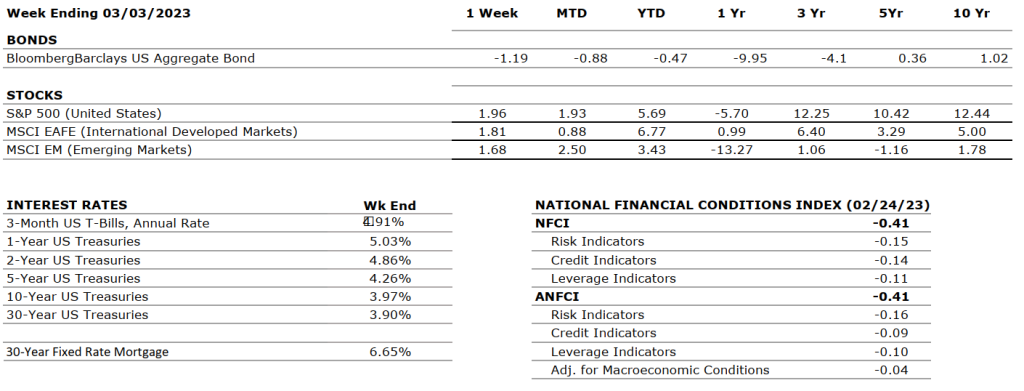
The Sources: Index Returns: Morningstar Workstation. Past performance is no guarantee of future results. Indices are unmanaged and cannot be invested into directly. Three, five and ten year returns are annualized. Interest Rates: Federal Reserve, Mortgage Bankers Association.
MARKET HEAT MAP
The health of the economy is a key driver of long-term returns in the stock market. Below, we assess the key economic conditions that we believe are of particular importance to investors.
|
US ECONOMY |
||
|
CONSUMER HEALTH |
NEUTRAL |
Real gross domestic product (GDP) increased at an annual rate of 2.9 percent in the fourth quarter of 2022 after increasing by 3.2 percent in the third quarter. The increase in the fourth quarter primarily reflected increases in inventory investment and consumer spending that were partly offset by a decrease in housing investment. |
|
CORPORATE EARNINGS |
NEUTRAL |
The earnings growth rate for Q4 2022 was -4.6%. In Q4, 68% of companies beat EPS estimates and 66% beat revenue expectations. For Q1 2023, earnings are expected to decline further at a rate of – 6.1%. The forward 12-month P/E ratio for the S&P 500 is now 17.2 – below the 5-year and 10-year averages of 18.5 and 17.3, respectively. |
|
EMPLOYMENT |
POSITIVE |
U.S. Nonfarm Payrolls for January 2023 increased by 311,000, and the unemployment rate hedged up to 3.6% from 3.4%. Leisure and hospitality, retail trade, government, and health care were among the sectors with the most notable gains. Employment declined in information, transportation, and warehousing. |
|
INFLATION |
NEGATIVE |
The annual inflation rate in the U.S. increased by 6.4% for January 2023 compared to the December 2022 reading of 6.5%. This is the lowest CPI value since October 2021. Core CPI increased at a rate of 5.6% versus 5.7% in December. The primary contributors to the increase in inflation were shelter, food, gasoline, and natural gas. On the other hand, indexes for used vehicles, medical care, and airline fares decreased over the month. |
|
FISCAL POLICY |
NEUTRAL |
A few weeks after taking control of the chamber, GOP lawmakers are pushing for austerity measures in hopes of improving the nation’s fiscal health. Democrats have responded with harsh criticism and stressed that they would not negotiate a deal with Republicans involving reductions of benefits. Meanwhile, the latest CBO projections show that rising interest rates and spending bills are adding to deficits as the U.S. is on track to add $19 trillion of new debt over the nextdecade. |
|
MONETARY POLICY |
NEGATIVE |
Earlier this month, the Fed approved a 25 bps rate hike taking its target range to 4.50%-4.75%. Although the magnitude of rate hikes has decreased, rates will likely be kept higher through 2023 with no reductions until 2024. The FOMC has also reiterated its commitment to return inflation to its 2% objective. The next Fed meeting is scheduled for March 21st and 22nd. |
|
GLOBAL CONSIDERATIONS |
||
|
GEOPOLITICAL RISKS |
NEGATIVE |
While the Russian-Ukraine conflict does not show signs of abating, additional geopolitical issues have arisen between the U.S. and China, as well as between the U.K. and the E.U. Secretary of State Blinken’s trip to China was canceled in the wake of the incidents involving Chinese spy balloons, which lead U.S. – China relations to deteriorate further. The U.K. and E.U. are involved in negotiation conflicts over tariffs and freedom of trade. |
|
ECONOMIC RISKS |
NEUTRAL |
Although the aforementioned geopolitical risks remain prevalent in the daily news, their effects on the global economy seem to have subsided. On the other hand, domestic economic risks have increased over the past week with the collapse of Silicon Valley Bank, which also brought down Signature Bank, another tech-central bank. The ripple effects of these failures seem to have been contained for now. However, the tech start-up industry will face headwinds until a replacement funding institution is found. |
The “Heat Map” is a subjective analysis based upon metrics that VNFA’s investment committee believes are important to financial markets and the economy. The “Heat Map” is designed for informational purposes only and is not intended for use as a basis for investment decisions.


