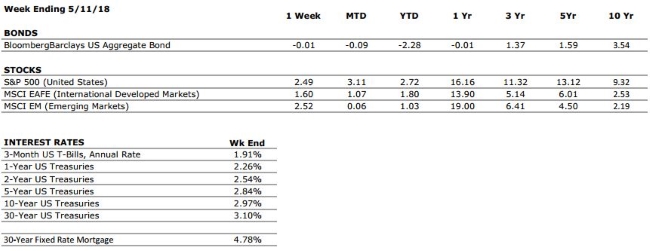
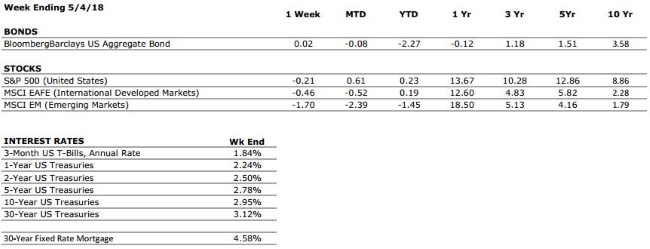
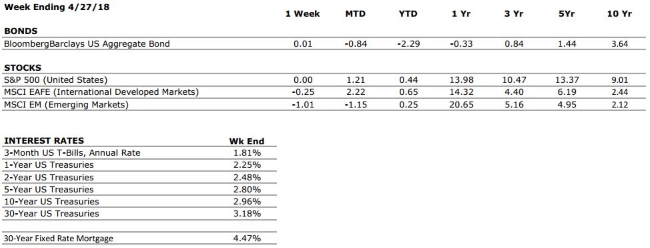
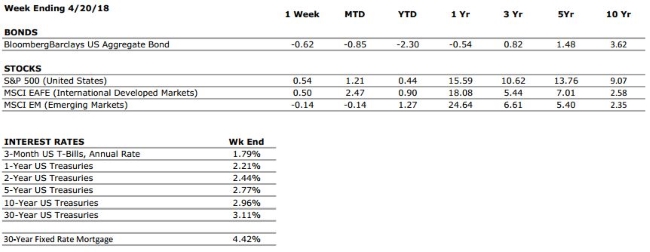
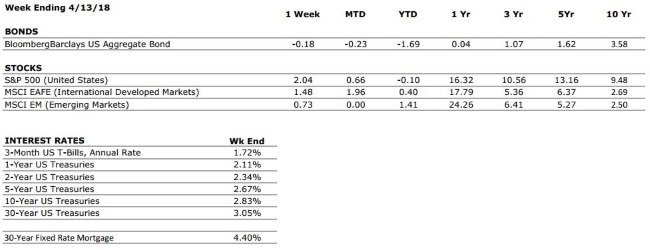
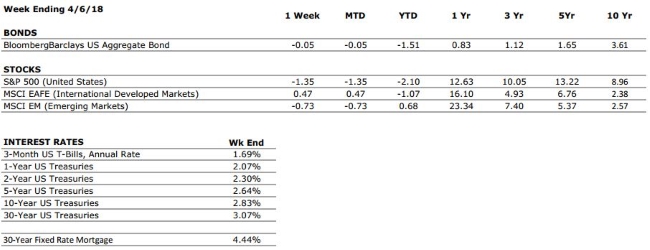
THE NUMBERS
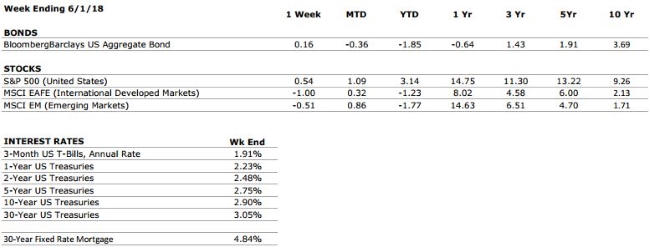
Sources: Index Returns: Morningstar Workstation. Past performance is no guarantee of future results. Indices are unmanaged and cannot be invested into directly. Three, five and ten year returns are annualized excluding dividends. Interest Rates: Federal Reserve, Freddie Mac
US ECONOMIC HEAT MAP
The health of the US economy is a key driver of long-term returns in the stock market. Below, we grade 5 key economic conditions that we believe are of particular importance to investors.
|
CONSUMER SPENDING |
A+ |
Consumer spending is expected to remain healthy as individuals with lower tax rates spend their windfalls. |
|
FED POLICIES |
C- |
The Federal Reserve increased the Fed Funds Rate by 0.25% in March, and is expected to implement at least 2 more hikes this year. Rising interest rates tend to reduce economic growth potential and can lead to repricing of income producing assets. |
|
BUSINESS PROFITABILITY |
A |
Q1 Earnings were very strong, with US companies reporting YoY earnings growth of 25%. |
|
EMPLOYMENT |
A+ |
The unemployment rate has dropped below 4% for the first time since 2000. Additionally, there are over 6 million unfilled job openings throughout the economy; close to an all-time record. |
|
INFLATION |
B |
Inflation is often a sign of “tightening” in the economy, and can be a signal that growth is peaking. The inflation rate remains benign at this time, but we see the potential for an increase moving forward. This metric deserves our attention. |
|
OTHER CONCERNS |
||
|
INTERNATIONAL RISKS |
5 |
The above ratings assume no international crisis. On a scale of 1 to 10 with 10 being the highest level of crisis, we rate these international risks collectively as a 5. These risks deserve our ongoing attention. |
The “Heat Map” is a subjective analysis based upon metrics that VNFA’s investment committee believes are important to financial markets and the economy. The “Heat Map” is designed for informational purposes only and is not intended for use as a basis for investment decisions.