The Numbers & “Heat Map”

THE NUMBERS
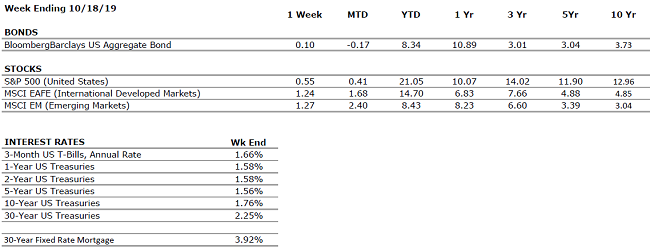
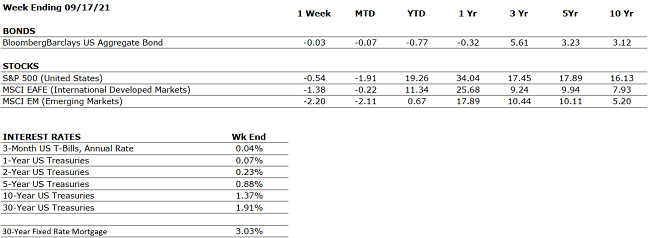
Sources: Index Returns: Morningstar Workstation. Past performance is no guarantee of future results. Indices are unmanaged and cannot be invested into directly. Three, five and ten year returns are annualized. Interest Rates: Federal Reserve, Mortgage Bankers Association.

MARKET HEAT MAP
The health of the economy is a key driver of long-term returns in the stock market. Below, we assess the key economic conditions that we believe are of particular importance to investors.

US ECONOMY

CONSUMER HEALTH

POSITIVE

August retail sales surprised to the upside, increasing 0.7% month-over-month, indicating that the Delta Variant has not had a material impact on the U.S. economy.

CORPORATE EARNINGS

POSITIVE

S&P 500 Q2 sales and earnings grew an astonishing 25% and 89%, respectively, when compared to the heavily depressed figures from Q2 2020.

EMPLOYMENT

POSITIVE

The unemployment rate is down to 5.2%. In August, new job creation was disappointing, but jobless claims were as low as they have been since March 2020.

INFLATION

NEUTRAL

CPI rose 5.3% year-over-year in August; CPI rose 5.4% in both June and July, respectively. Fed Chairman Jay Powell is resolute that the high inflation is transitory and will decelerate as global supply chain bottlenecks resolve. Meanwhile, consumers expect CPI to be 5.2% over the next 12 months.

FISCAL POLICY

POSITIVE

The Senate passed a $1 trillion infrastructure package. The bill is expected to be voted on by The House by the end of this year.

MONETARY POLICY

POSITIVE

The Federal Reserve has indicated that it does not plan to increase interest rates until 2023.

GLOBAL CONSIDERATIONS

GEOPOLITICAL RISKS

NEUTRAL

Although the Taliban’s control in Afghanistan is concerning, it is unlikely to have a meaningful economic impact.

ECONOMIC RISKS

NEUTRAL

With multiple vaccines in distribution and accommodative fiscal and monetary policies in place, 2021 is shaping up as one of the strongest economic years on record. The primary risk at present is that of persistent inflation which begets higher interest rates.

The “Heat Map” is a subjective analysis based upon metrics that VNFA’s investment committee believes are important to financial markets and the economy. The “Heat Map” is designed for informational purposes only and is not intended for use as a basis for investment decisions.

Current Market Observations

by William Henderson, Vice President / Head of Investments
As the month of April 2021 wrapped up, we saw modest selling across the markets as both stocks and bonds ended the week lower in price. For the week that ended April 30, 2021, the Dow Jones Industrial Average fell by -0.5%, the S&P 500 Index was unchanged, and the NASDAQ fell by -0.4%. The 10-year U.S. Treasury Bond closed the week at 1.64%, higher by six basis points compared to the previous week. Bond yields move in the opposite direction of bond prices. While selling was evident, the resulting pressure on the markets did nothing to erase the strong year-to-date returns we have seen. Year-to-date, the Dow Jones Industrial Average has returned +11.3%, the S&P 500 Index +11.8% and the NASDAQ +8.6%.  

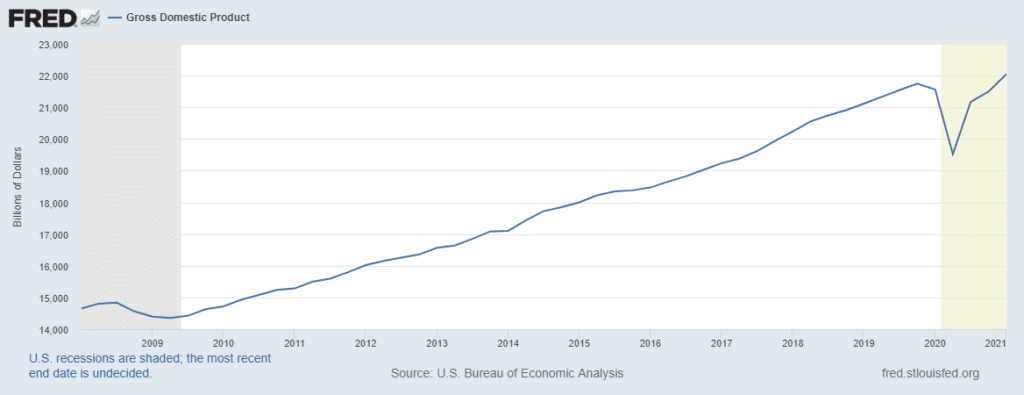
First quarter 2021 U.S. GDP was released last week, and the number was a blow out, as expected.  With the help of two rounds of stimulus payments and continued progress in vaccinations, first-quarter GDP grew by 6.4% on an annualized basis up from 4.3% in the fourth quarter of 2020. The chart below from the Federal Reserve Bank of St. Louis, shows GDP is now only 1% below its previous high and is clearly on track to return to pre-pandemic levels as soon as the second quarter of 2021. Further, economic activity was strong in consumer spending, up 10.7% in the first quarter, and business investment up a solid 9.9% in the same period. 

Last week’s selling took place in the technology sector, specifically production firms related to oil or oil production. The price of West Texas Intermediate crude oil fell more than 2% last week and is now running 4% below the high hit at the beginning of March 2021. While that may be bad news for oil drillers, it is good news for the rare person these days that is worried about inflation. 

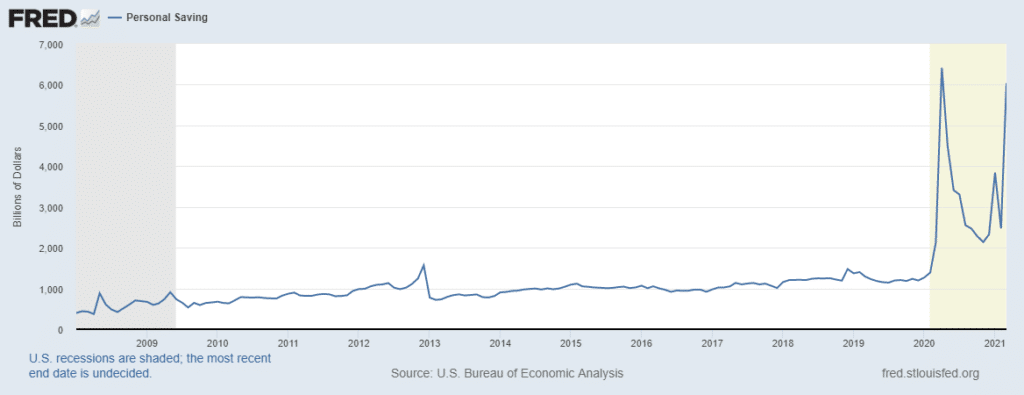
Last week also produced some winners; importantly we saw strong performance in “reopening-sensitive” stocks such as Norwegian Cruise Lines and American Airlines. As vaccine distribution continues across the country, more and more sectors of the economy will open, and the consumer will be released to spend the cash hoard they have amassed over the past year. See the graph below from the Federal Reserve Bank of St. Louis showing the personal savings rate for the U.S. households.   

As we have said for many weeks now, the building blocks of vaccine distribution, healthy consumer and corporate balance sheets, record fiscal stimulus and continued monetary stimulus, are all in place to propel the economy and markets forward well into 2022. Confirming the monetary stimulus, last week U.S. Fed Chairman Jerome Powell, in his press conference after the FOMC meeting, stuck to his dovish tune on interest rates and nearly guaranteed that rates will stay low for a long time. The Fed remains laser-focused on employment and inflation and neither are meeting the target they have set: full employment and inflation averaging 2% per year.   

As a final boost to consumer spirits, resulting from favorable progress on fighting the pandemic, President Biden announced eased restrictions on wearing masks outdoors and several major cities, including New York and Philadelphia, will completely “reopen” July 1. Vastly positive economic conditions exist in the U.S. and we expect continuation of the same, even in the face of potentially higher personal and corporate income tax rates. 

Current Market Observations

by William Henderson, Vice President / Head of Investments
Positive returns across all three broad market indices in a Good Friday holiday-shortened week gave investors reason to celebrate into the Easter Weekend. For the week ended April 1, 2021, the Dow Jones Industrial Average returned +1.6%, the S&P 500 Index gained +2.8%, and the NASDAQ jumped a healthy +3.9%. Strong weekly gains in all three broader market indices added to positive returns thus far for the full year. Year-to-date, the Dow Jones Industrial Average has returned +8.9, the S&P 500 Index +7.4% and the NASDAQ +4.8%. Stronger relative gains for the Dow Jones Industrial average simply point to the common story this year of a shift from growth to value; with growth stocks best represented by the technology heavy NASDAQ and value stocks better represented by industrial and financial stalwarts that make up the Dow. Generally, as an economic cycle matures, value stocks begin to outperform growth stocks, and this is exactly what we are seeing play out nicely in 2021. Lastly, the bell weather 10-year U.S. Treasury Bond rose by a modest four basis points during the previous week to end at 1.72%.

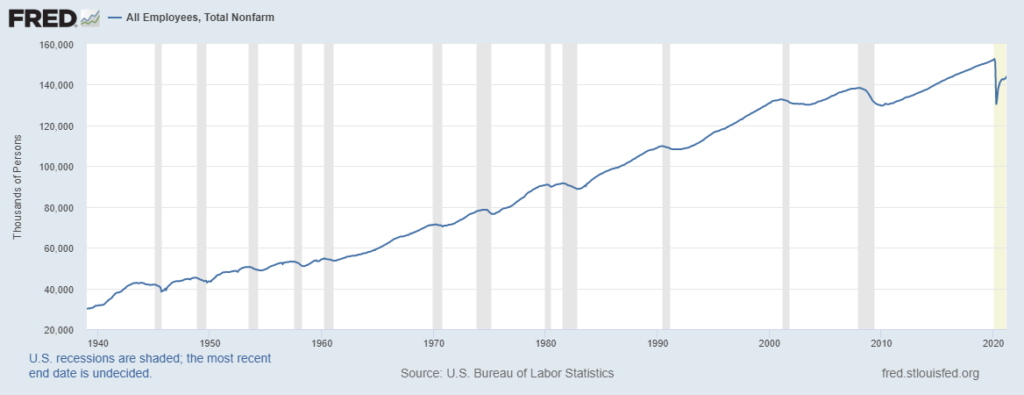
Last week, the Labor Department’s March jobs report showed a nonfarm payroll gain of 916,000 vs. economists expectation of up 625,000. Easing COVID-19 restrictions on travel and leisure and multiple stimulus packages will continue to allow job growth to boom.  Total U.S. Payroll Employment stood at 144.1 million, significantly higher since the pandemic low in 2020. (See chart below from the Federal Reserve Bank of St. Louis.) 

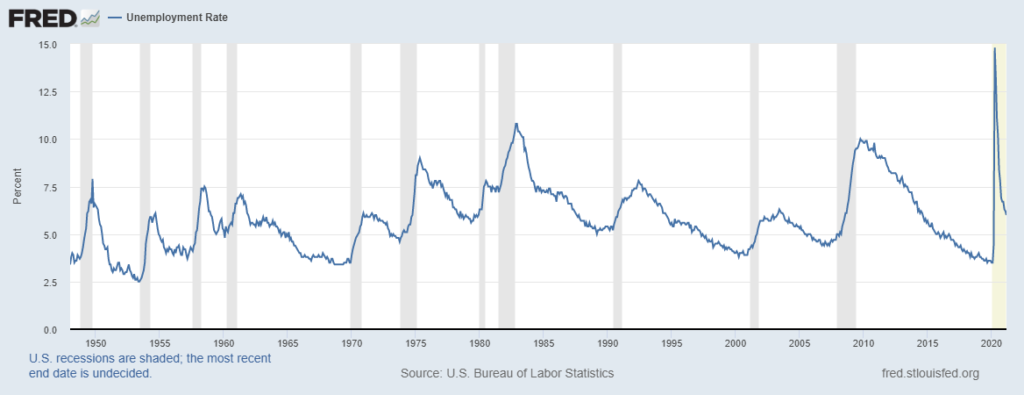
Further, the jobless rate fell to 6% from 6.2%, in line with estimates and further pointing to a strong rebound in employment and the economy. (See chart below from Federal Reserve Bank of St. Louis.) 

Strong increases in payrolls and a resultant decrease in unemployment are pushing economists such at Cornerstone Macro, to predict a 9% real GDP outlook for 2021. Further, employment gains could push the unemployment rate to 3.5% by year-end 2021 and potentially as low as 2.8% in 2022.   

Responsible Investing and ESG (Environmental, Social & Governance) focused dollars are taking the headlines this year with many large investment managers pressuring U.S. Corporations to place greater emphasis on doing good rather than just doing. Investment managers are stressing that Responsible Investing is possible without sacrificing returns. Improvements in technology are allowing tectonic positive shifts in sustainable and responsible investing. Last week, Vanguard Group Inc. and Blackrock Inc., along with 41 other investment management firms representing $23 trillion of assets joined the “Net Zero Asset Managers” initiative. This initiative is pledging to support efforts that place a greater focus on investors as activists for their clients and to influence companies to use their substantial resources in a more responsible and sustainable way. 

In this professional’s opinion, whether viewed as a divisive issue or not, Responsible Investing can be acceptable to everyone. I would like to believe that all investors want clean air to breath, fresh water to drink and healthy forests and parks for recreation. Valley National Financial Advisors can assist clients with building and maintaining a portfolio with a clear focus on Responsible Investing. VNFA is a steward for our client’s assets and, as such, can help them become a steward of all resources. 

The Markets This Week

by Connor Darrell CFA, Assistant Vice President – Head of Investments
Markets tracked lower last week as investors began to ponder whether equity market valuations were justified after several weeks of gains. The odds of what many have referred to as a potential “V” shaped recovery look increasingly small, as many in the scientific community have continued to caution that economic activity will not be able to resume to pre-virus levels until after a vaccine is developed and globally distributed. Also weighing on investor sentiment has been the resurgence of tensions in the relationship between the United States and China. Last week, U.S. intelligence sources accused China of attempting to steal COVID-19 related research through cyberattacks. The Trump Administration has also not shied away from sharing its belief that the Chinese government acted deceitfully in covering up key details about the spread of the disease within mainland China. Trump himself has even gone so far as to say that there is a reasonable probability the origins of the virus can be traced to a laboratory in Wuhan.

The true origins of the virus are unlikely to be confirmed with certainty in the near-future, and it is possible that they are never irrefutably determined. However, the re-escalation of tensions within an already strained U.S./China relationship is a key concern moving forward for global investors. No matter the efficacy of accusatory claims made by leaders within both countries, it is clear that the emergence of the COVID-19 pandemic has fostered additional distrust between the U.S. and China that may ultimately prove to be permanent. The long-term consequences of that distrust are likely to pressure on recent globalization trends and could lead to a shift in global supply chains. In the near-term, it is likely to simply remain another potential source of volatility in markets.

Did You Know…?

News and information related to COVID-19 is being released and updated very rapidly. Our team has collected just a few of the latest links that we think may be most valuable to our clients.

VNFA NEWS

March Tax Reminder!
We are approaching the one-month mark away from the tax deadline for filing 2019 individual returns. If our VNFA Team is preparing your 2019 tax return(s), please send us your tax documents as soon as possible – even if you are still waiting on certain items. You can deliver them to our office or post digital copies to your secure eVault Client Portal.

Visit our website at valleynationalgroup.com/tax for checklists and resources to help you collect relevant information. If you have any questions, please contact our team at tax@valleynationalgroup.com.

VNFA NEWS

We are pleased to announce the promotion of Elizabeth Wilson, CPA to the position of Chief Financial Officer.

Elizabeth joined the company as Corporate Controller in 2014, and was most recently Vice President, Finance & Tax Services. As part of the executive management team at VNFA, she oversees firm-wide financial operations as well as strategic and risk management, in addition to serving as Head of Tax Services.

VNFA Executive Management Team (left to right): Judianne Harris CMO, Matthew Petrozelli CEO, Elizabeth Wilson CFO

Elizabeth is a Certified Public Accountant with more than 15 years of experience in accounting and management. A graduate of Muhlenberg College in Allentown with a B.A. in Accounting and Business Administration, Elizabeth moved back to the Lehigh Valley from New York City to join the VNFA team. She was recognized in 2018 by the PICPA (Pennsylvania Institute of Certified Public Accountants) with the Young Leader Award; and in 2019 was named the Lehigh Valley Business CFO of the Year Rising Star.

The Markets This Week

by Connor Darrell CFA, Assistant Vice President – Head of Investments
Both equities and bonds managed to creep higher last week, with equities fueled by positive developments in global politics (Brexit and U.S./China trade negotiations) and bonds buoyed by a drop in short-term yields that was likely driven by weaker than expected retail sales data. The 0.3% decline in U.S. retail sales was the first monthly decline since February and was primarily a product of a decrease in so-called “noncore” spending, which includes auto sales, purchases at gas stations, and building materials stores. Moving forward, many will be watching this and other consumer data very closely in an effort to get a feel for whether the weakness in manufacturing has permeated to other areas of the economy. For now, this looks more like a blip rather than a sustained downward trend, and the U.S. consumer should continue to benefit from the healthiest labor market in decades.

Politics and the Market
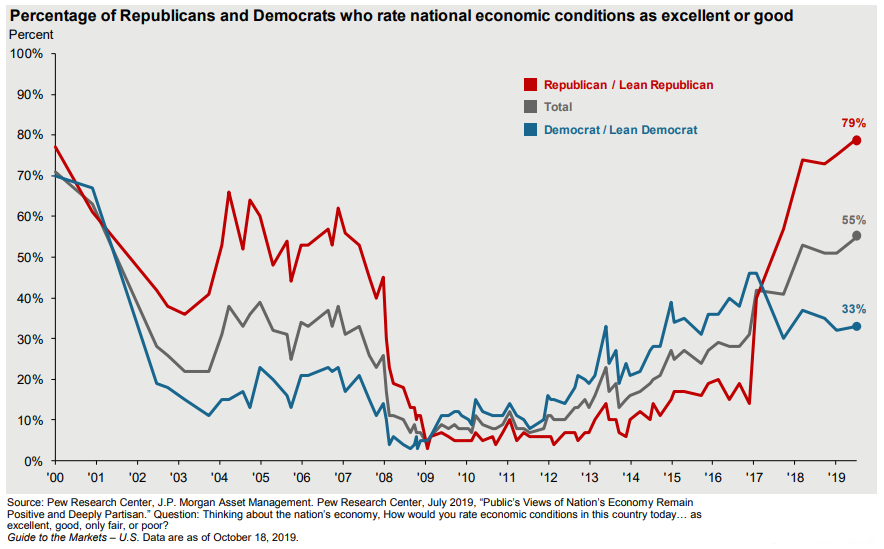
As the political climate has continued to become more and more polarized in recent years, many Americans have had a hard time separating politics from investing. We believe the below chart from JPMorgan does an excellent job of helping to convey the importance of investing discipline during periods of difficult political transition.

The chart shows consumer confidence broken down by political affiliation and tells an interesting story. Beginning in 2008 at the onset of the Great Recession, it is clear and unsurprising that neither Republicans nor Democrats felt optimistic about the economy. But as the market and economy recovered during the Obama administration, optimism among Democrats increased at a significantly higher rate. Then, almost overnight in the beginning of 2017, optimism among Republicans skyrocketed and subsequently tapered off among Democrats. Based on the data, it is clear that many Republican-leaning investors may have missed out on the strong market gains during the Obama years, and that many Democrat-leaning investors may have missed out on the market rally that transpired during the Trump years.

With all the talk of concerns over the global economy and weakening manufacturing, the consumer remains pivotal in determining how much juice is left in this economic expansion. With that as a backdrop, one other intriguing aspect of the above chart is that at present, consumer confidence among Republican-leaning investors remains very high. Market sentiment and economic activity are quite sensitive to consumer perceptions of the future, and it certainly makes it more difficult for the economy to turn toward recession if roughly half the population believes things are still looking great.

The Number & “Heat Map”

THE NUMBERS
Sources: Index Returns: Morningstar Workstation. Past performance is no guarantee of future results. Indices are unmanaged and cannot be invested into directly. Three, five and ten year returns are annualized excluding dividends. Interest Rates: Federal Reserve, Freddie Mac

U.S. ECONOMIC HEAT MAP
The health of the U.S. economy is a key driver of long-term returns in the stock market. Below, we grade 5 key economic conditions that we believe are of particular importance to investors.

CONSUMER SPENDING

A

Our consumer spending grade remains an A despite a recent decline in retail sales numbers. US consumer confidence remains high, but we will be watching this metric closely over the next couple of weeks and throughout earnings season. The consumer has been the bedrock of the US economy through much of the current expansion.

FED POLICIES

A-

Our Fed Policies grade has been increased to A- after the Federal Reserve cut its interest rate target by 25 bps following its most recent meeting. This marks the second time the Fed has cut interest rates in the past few months, but Chairman Jerome Powell hinted that he does not expect “a more extensive series of rate cuts” moving forward.

BUSINESS PROFITABILITY

B-

As was largely expected by markets, corporate earnings growth has been weak thus far in Q3 as a result of the global slowdown and trade policy uncertainty. Throughout earnings season, we will be paying closer attention to management commentary and updates to forward guidance, which are likely to have a bigger impact on stock prices.

EMPLOYMENT

A

The US economy added 136,000 new jobs in September, below the consensus expectations of analysts. However, despite the lower than expected job creation, there was evidence of an acceleration of wage growth. The labor market continues to look quite healthy.

INFLATION

A

Inflation is often a sign of “tightening” in the economy and can be a signal that growth is peaking. Recent inflationary data has increased slightly, but inflation remains benign at this time, which bodes well for the extension of the economic cycle.

OTHER CONCERNS

INTERNATIONAL RISKS

7

Following a re-escalation of the US/China trade dispute, we have raised our “international risks” metric back to a 7. Other key areas of focus for markets include the ongoing Brexit negotiations, rising economic nationalism around the globe, and escalating tensions in the Middle East.

The “Heat Map” is a subjective analysis based upon metrics that VNFA’s investment committee believes are important to financial markets and the economy. The “Heat Map” is designed for informational purposes only and is not intended for use as a basis for investment decisions.