The Markets This Week

by Connor Darrell CFA, Assistant Vice President – Head of Investments
Equities climbed higher during the holiday shortened week, bolstered by rising optimism surrounding the anticipated “Phase One” trade deal between the U.S. and China. It’s beginning to look as if the proposed agreement will be more comprehensive than many had anticipated, with stronger intellectual property protections being included in the discussions.

The week also brought some encouraging economic news. Data on new home sales came in above analyst expectations and durable goods orders rebounded from recent lows. Additionally, the second estimate of U.S. GDP for the third quarter was revised upward and now stands at 2.1%. Particularly encouraging was that the upward revision was due to a smaller decline in business investment than was initially measured, suggesting that the impacts of the ongoing trade dispute may be starting to wane.

Some Perspective on the National Debt
Aside from the constant calls in the news media for an “impending recession,” there are few issues that seem to worry everyday investors more than the national debt (there’s even a popular website called “U.S. Debt Clock” which keeps a running tally). For many, the rising debt is an albatross that hangs over the markets and threatens the long-term sustainability of economic growth. However, it’s important for us to keep things in perspective, and even more important to keep our concerns as private citizens and taxpayers separate from our convictions as long-term investors.

The national debt continues to rise, and with the government currently running at a deficit, that trend is likely to continue well into the future. Looking through recent history, it’s clear that the size of the national debt and the annual budget deficit with which the government operates are, in large part, results of the fiscal decisions made during the 2008 financial crisis. The government responded to the crisis by ramping up spending in order to keep the financial system from collapsing and faced a $1.4 trillion deficit in 2009 as a result. At a little less than $1 trillion, the current deficit is a bit smaller than it was in the depths of the crisis but is still a staggeringly high number. Regardless of the magnitude of the deficit, it’s most likely that investors do not need to live in fear when it comes to their portfolios. When discussing debt levels, it’s not the absolute level of debt or annual deficits that are most important, but rather their size in relation to the overall economy.
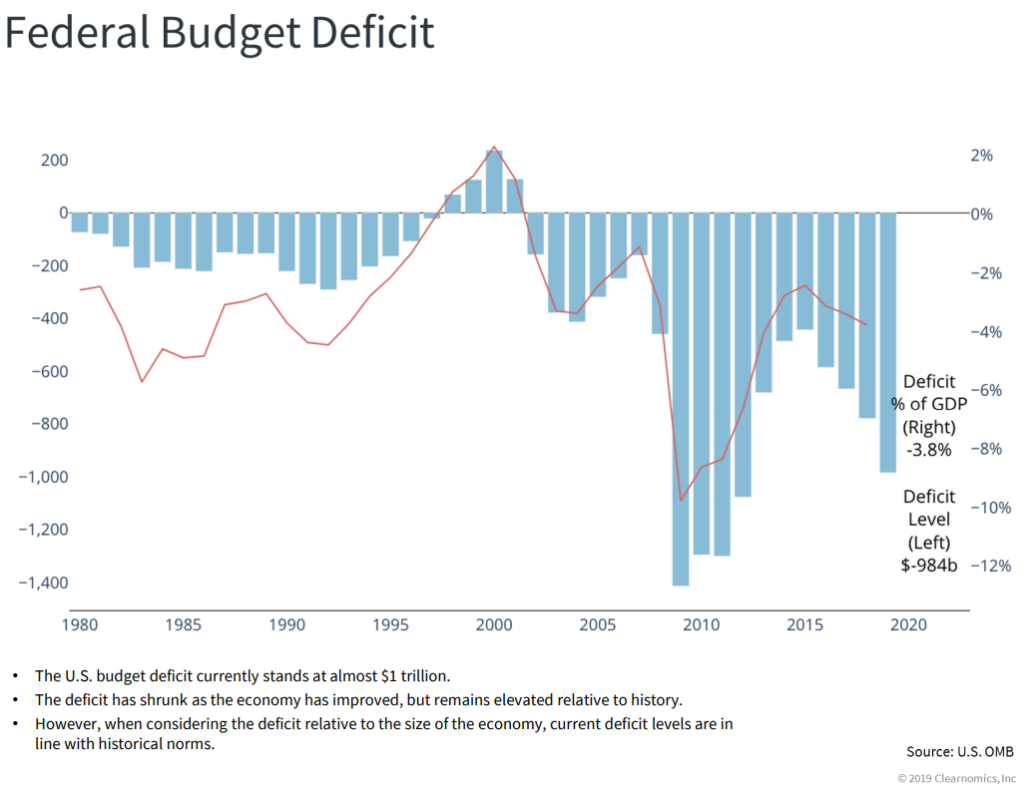
With that in mind, while current deficits are inarguably high, they are still within historical norms after considering the size of the U.S. economy has also grown significantly. Even if the current deficit as a percentage of GDP (which currently sits at about 3.8%) were to rise by several percentage points over the next year or two, it will still remain well below the 10% levels observed in 2009 and right on par with where things stood back in the early 80s. In other words, while debt is not something to be ignored, it is unlikely to have a direct impact on the profitability of companies or the yield spreads on bonds. Another important consideration when thinking about the potential impacts of high debt levels is the cost of that debt. With interest rates still very low, the cost of servicing debt is much lower than it has been at most other points in our nation’s history, which makes carrying higher levels of debt more tolerable. For most investors, the current level of national debt should rank low on the list of potential concerns from a portfolio management perspective.

The Numbers & “Heat Map”

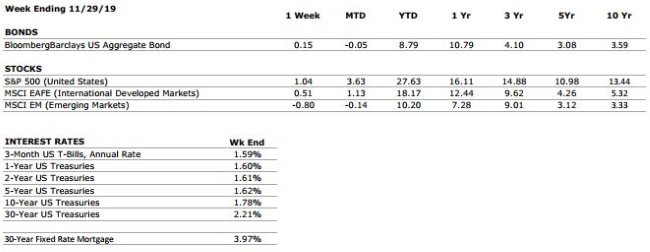
THE NUMBERS
Sources: Index Returns: Morningstar Workstation. Past performance is no guarantee of future results. Indices are unmanaged and cannot be invested into directly. Three, five and ten year returns are annualized excluding dividends. Interest Rates: Federal Reserve, Freddie Mac

U.S. ECONOMIC HEAT MAP
The health of the U.S. economy is a key driver of long-term returns in the stock market. Below, we grade 5 key economic conditions that we believe are of particular importance to investors.

CONSUMER SPENDING

A

Our consumer spending grade remains an A despite recent softening in retail sales numbers. US consumer confidence remains high, and we anticipate a strong holiday shopping season. The consumer has been the bedrock of the US economy through much of the current expansion.

FED POLICIES

A-

The Federal Reserve cut its interest rate target three times during 2019, but Chairman Jerome Powell signaled to markets that the most recent cut may be the last adjustment to the Fed’s policy target until there is a meaningful shift in the economic data (either positive or negative).

BUSINESS PROFITABILITY

B-

As was largely expected by markets, corporate earnings growth was weak during Q3 as a result of the global slowdown and trade policy uncertainty. However, according to Factset, 75% of S&P 500 companies reported a positive earnings surprise, meaning things were not quite as weak as many had feared.

EMPLOYMENT

A

The US economy added a healthy 128,000 new jobs in October. Furthermore, there were upward revisions to data from the September and August reports in addition to evidence of strong wage growth. Considering the slew of negative sentiment leading up to its release, this was one of the more uplifting release in recent memory.

INFLATION

A

Inflation is often a sign of “tightening” in the economy, and can be a signal that growth is peaking. Recent inflationary data has increased slightly, but inflation remains benign at this time, which bodes well for the extension of the economic cycle.

OTHER CONCERNS

INTERNATIONAL RISKS

7

Despite the US & China being close to a “Phase One” agreement, we are keeping our “international risks” metric at an elevated level of 7 for now. Other key areas of focus for markets include the ongoing Brexit negotiations, rising economic nationalism around the globe, and escalating tensions in the Middle East.

The “Heat Map” is a subjective analysis based upon metrics that VNFA’s investment committee believes are important to financial markets and the economy. The “Heat Map” is designed for informational purposes only and is not intended for use as a basis for investment decisions.

“Your Financial Choices”

The show airs on WDIY Wednesday evenings, from 6-7 p.m. The show is hosted by Valley National’s Laurie Siebert CPA, CFP®, AEP®.

This week Laurie be joined by representatives from Capital Blue Cross to discuss: “Medicare – more to know.”

Laurie will take your questions live on the air at 610-758-8810 or in advance via yourfinancialchoices.com/contactlaurie.

Recordings of past shows are available to listen or download at both yourfinancialchoices.com and wdiy.org.

VNFA NEWS

Thanksgiving Holiday Office Hours
Our offices will be closed on Thursday, November 28, and closing early with the markets at 1 p.m. on Friday, November 29. All of us at VNFA are grateful for our family of clients and friends. Happy Thanksgiving!

The Markets This Week

by Connor Darrell CFA, Assistant Vice President – Head of Investments
Markets were largely stagnant last week as investors continued to wait patiently for further developments in the U.S./China trade negotiations. On Friday, Chinese President Xi Jinping stated that the Chinese wish to reach a “phase one” deal with the United States that is based upon “mutual respect and understanding,” further reiterating that while he does not want the trade war to escalate further, he would push back on U.S. demands when deemed necessary. As the rhetoric from Washington continues to suggest that a phase one deal is “very close,” the U.S. Department of Commerce issued a 90-day extension for U.S. companies to continue doing business with China’s Huawei for the third time. Bond yields moved modestly lower during the week as the lack of material development in the trade discussions seemed to outweigh some positive economic signals, which included evidence of stabilization in global manufacturing activity.

Happy Thanksgiving
In honor of one of America’s favorite holidays, we wanted to share some fun facts (courtesy of JP Morgan Asset Management and WalletHub.com) about the Thanksgiving season:

  • This year, the average cost of a 10-person Thanksgiving dinner is $48.91, only $0.01 higher than last year. Why such a small increase? As a result of ample Turkey supply, the price of a 16-lb. turkey decreased by $0.91 compared to last year and is expected to cost about $20.80.
  • Each year, American spend an estimated $550 million on Thanksgiving turkeys. At a price of $1.30/pound, that’s over 423 million pounds of Turkey.
  • In 2018, Americans spent over $3.7 billion while shopping online during Thanksgiving Day.
  • Over 54 million Americans are expected to travel for this year’s holiday (the most since 2005). 89.4% of those travelers will drive to their destinations.
  • The average shopper spends $313 over the five-day thanksgiving shopping period (Thanksgiving Day thru Cyber Monday).
  • The NFL’s three-game Thanksgiving schedule pulled in nearly 79 million combined viewers last year.
  • The Thanksgiving football tradition dates back to 1876, when Yale defeated Princeton in a game played in Hoboken, NJ.
  • In a survey of what Americans are most thankful for, the most popular responses were Family (88%), Health (77%), and Personal Freedom (72%), with Wealth (32%) being one of the least popular choices.

Did You Know…?

Next week is the 4th annual National Tax Security Awareness Week – December 2 through December 6. According to the IRS, this is the heaviest period of time when people are online and when phishing is most common. The five days, starting with Cyber Monday, will feature topics about basic security guidance.

  • Day 1: Protect personal and financial information online
  • Day 2: Learn to recognize phishing emails and phone scams
  • Day 3: Create strong passwords to protect online accounts
  • Day 4: Recognize clues of identity theft
  • Day 5: Tax professionals should review their safeguards

Read the IRS guidance around each of these topics and more about the resources that will be available to help protect taxpayers and tax pros against identity theft at irs.gov.

The Numbers & “Heat Map”

THE NUMBERS
Sources: Index Returns: Morningstar Workstation. Past performance is no guarantee of future results. Indices are unmanaged and cannot be invested into directly. Three, five and ten year returns are annualized excluding dividends. Interest Rates: Federal Reserve, Freddie Mac

U.S. ECONOMIC HEAT MAP
The health of the U.S. economy is a key driver of long-term returns in the stock market. Below, we grade 5 key economic conditions that we believe are of particular importance to investors.

CONSUMER SPENDING

A

Our consumer spending grade remains an A despite recent softening in retail sales numbers. US consumer confidence remains high, but we will be watching this metric closely over the next couple of weeks and throughout earnings season. The consumer has been the bedrock of the US economy through much of the current expansion.

FED POLICIES

A-

The Federal Reserve cut its interest rate target by an additional 25 bps last month. This was the third cut this year, but Chairman Jerome Powell signaled to markets that we this may be the last adjustment to the Fed’s policy target until there is a meaningful shift in the economic data (either positive or negative).

BUSINESS PROFITABILITY

B-

As was largely expected by markets, corporate earnings growth was weak during Q3 as a result of the global slowdown and trade policy uncertainty. However, according to Factset, 75% of S&P 500 companies reported a positive earnings surprise, meaning things were not quite as weak as many had feared.

EMPLOYMENT

A

The US economy added a healthy 128,000 new jobs in October. Furthermore, there were upward revisions to data from the September and August reports in addition to evidence of strong wage growth. Considering the slew of negative sentiment leading up to its release, this was one of the more uplifting release in recent memory.

INFLATION

A

Inflation is often a sign of “tightening” in the economy, and can be a signal that growth is peaking. Recent inflationary data has increased slightly, but inflation remains benign at this time, which bodes well for the extension of the economic cycle.

OTHER CONCERNS

INTERNATIONAL RISKS

7

Despite the US & China being close to a “Phase One” agreement, we are keeping our “international risks” metric at an elevated level of 7 for now. Other key areas of focus for markets include the ongoing Brexit negotiations, rising economic nationalism around the globe, and escalating tensions in the Middle East.

The “Heat Map” is a subjective analysis based upon metrics that VNFA’s investment committee believes are important to financial markets and the economy. The “Heat Map” is designed for informational purposes only and is not intended for use as a basis for investment decisions.