Current Market Observations

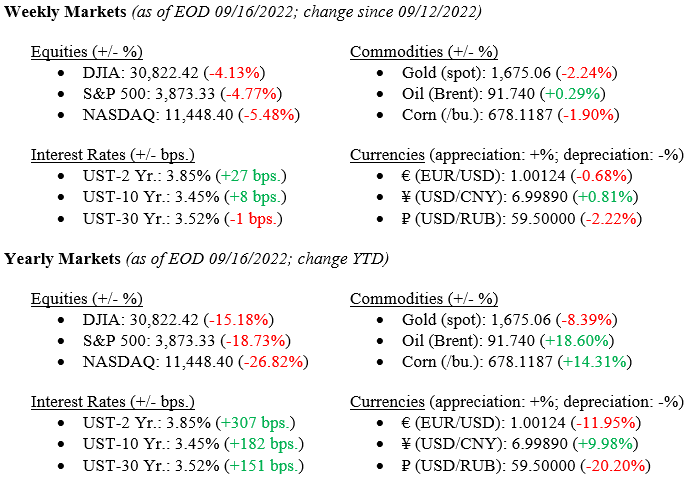
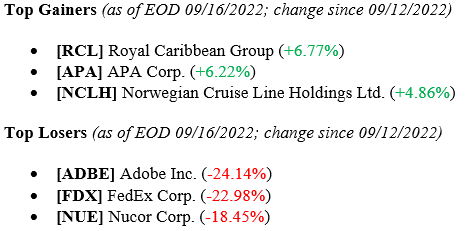
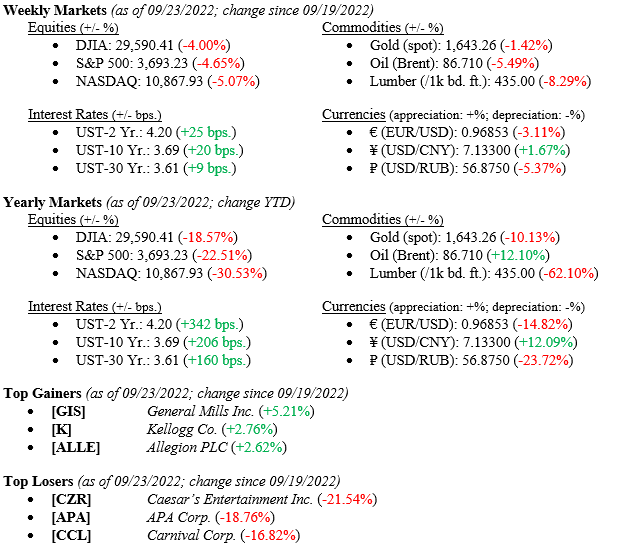
Market volatility continued last week as uncertainty around the Federal Reserve weighed heavily on investors. As was widely expected, the Fed raised interest rates by 75bps, bringing its target rate to 3.00-3.25%, while also adding language suggesting that further rate hikes are likely. As we implied last week, market movements are becoming increasingly tied to Fed decisions. However, it is important to remember that the Fed is only able to influence the relative movements in markets that are short-term, while long-term investors can capitalize on these down markets. Just to reiterate our point: this is an opportunity for wealth creation, not something to be afraid of as a long-term individual investor.
Global Economy
The Federal Reserve raised rates by 75 basis points on Wednesday, its third consecutive 0.75% rate hike this year. However, rate hikes are persistent across the globe to combat inflation, which is ringing in at 9.2% annually within the G20 countries. It is important to remember that inflation is not caused solely by policy within any given country due to increased globalization. Chart 1 below shows central banks’ rate paths over the prior three years. The Federal Reserve has indicated that it will raise rates by 1.00% to 1.25% over its next two meetings.

The U.S. housing market fell for the seventh straight month in August as mortgage rates hit new averages above 6% for the first time since 2008. Thirty-year mortgage rates a year ago were 2.86%. Sales of previously owned homes fell 0.4% in August to a rate of 4.8 million. (See Chart 2 below) Year-over-year, sales fell 19.9%. Home sales data tends to be lagged due to the length of the home-buying process — meaning that home purchases in August really reflect mortgage approvals from earlier in the summer when rates were modestly lower. We will not see the effects of these new highs in mortgage rates until closer to the end of the year.

What to Watch

  • Avg. U.S. Retail Gas Price figures to be released Monday, Sept. 26th at 4:30 PM EST.
  • Case-Shiller Home Price Index data to be released Tuesday, Sept. 27th at 9:00 AM EST.
  • U.S. Crude Oil Stocks week-over-week figures to be released Wednesday, Sept. 28th at 10:30 AM EST.
  • 30-Year Mortgage Rate data to be released Thursday, Sept. 29th at 10:00 AM EST.
  • U.S. Core PCE (Personal Consumption Expenditures) Price Index month-over-month figures to be released Friday, Sept. 30th at 8:30 AM EST.

The Numbers & “Heat Map”

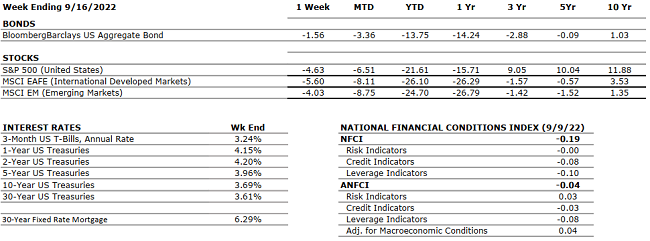
THE NUMBERS

The Sources: Index Returns: Morningstar Workstation. Past performance is no guarantee of future results. Indices are unmanaged and cannot be invested into directly. Three, five and ten year returns are annualized. Interest Rates: Federal Reserve, Mortgage Bankers Association.

MARKET HEAT MAP
The health of the economy is a key driver of long-term returns in the stock market. Below, we assess the key economic conditions that we believe are of particular importance to investors.

US ECONOMY

CONSUMER HEALTH

NEUTRAL

Q1 2022 Real GDP shrunk at a 1.6% annual rate. The main factors that resulted in a decrease in GDP were a surge in imports and trade deficit highlighting that the U.S. is buying more goods from foreign countries. According to the second estimate, real GDP for Q2 2022 decreased at an annual rate of 0.6% (up from the first estimate of -0.9%) marking the second consecutive quarter of declining GDP.

CORPORATE EARNINGS

NEUTRAL

The earnings growth rate for Q2 2022 was 6.7% (up from previous estimates of 4.3%) which marked a new post-pandemic low; but still solidly in the “growth” stage. The estimated growth rate for Q3 2022 is 3.2%, which was adjusted downward from 9.8% in June. 6 out of 10 S&P 500 companies that reported earnings beat estimated EPS and 7 beat revenue expectations.

EMPLOYMENT

NEUTRAL

U.S. Nonfarm Payrolls for August 2022 increased by 315,000 and the unemployment rate for August rose slightly to 3.7% compared to 3.5% in July. Professional and business services, health care, and retail trade were among the sectors with the most notable job gains.

INFLATION

NEGATIVE

The annual inflation rate in the U.S. increased by 8.3% for August 2022 — below the 8.5% in July but above the expected 8.1%. Food prices saw the largest increases since 1979 (11.4%), shelter and used cars also impacted inflation significantly. Core CPI increased 6.3% year-over-year, the most since March, and up from 5.9% in both June and July.

FISCAL POLICY

NEUTRAL

Senator Manchin and Majority Leader Schumer reached an agreement on the latest tax and energy bill with incentives for green energy, electric cars, and conversely oil & gas companies for exploration. No changes in private equity taxes or higher tax rates for the very wealthy were enacted. The bill has been officially passed by the Senate. Last week, President Biden announced student loan forgiveness of up to $20,000 subject to income limitations.

MONETARY POLICY

NEGATIVE

With inflation still running hot, Fed Chairman Jay Powell is clear on his path to slow the economy enough to cool inflation. The Fed raised rates by 0.75% last week, bringing its target rate to 3.00- 3.25%, and suggesting that additional rate hikes are likely in the coming months.

GLOBAL CONSIDERATIONS

GEOPOLITICAL RISKS

NEGATIVE

Russia has defaulted on its debt as of late June for the first time since 1918. Sanctions imposed by Western powers effectively isolated Russia and its financial system from Europe and the U.S. making it much harder for Russia to complete international financial transactions. Putin announced last week that Russia is ready to use nuclear weapons to defend its territory as they look to annex four regions in the south and east of Ukraine.

ECONOMIC RISKS

NEGATIVE

COVID-19 lockdowns in China are persistent and the ongoing Russian-Ukraine war is causing a major energy crisis in Europe. Putin shut down the pipeline that supplies Europe with natural gas indefinitely until all sanctions affecting Russia are lifted. European countries are struggling to find alternative energy resources and are starting to implement significant restrictions on the use of energy in households and businesses.

The “Heat Map” is a subjective analysis based upon metrics that VNFA’s investment committee believes are important to financial markets and the economy. The “Heat Map” is designed for informational purposes only and is not intended for use as a basis for investment decisions.

Current Market Observations

Equity markets logged a poor week of returns mainly due to inflation data surprising slightly to the upside. This was an emotional reaction to counteract widespread optimism.“It’s not timing the markets, it’s time in the markets” is an adage that continues to hold true despite recent volatility and noise. This is when long-term investors with a goal of wealth creation endure. 

Global Economy 
Last week, U.S. inflation came in at an annualized 8.3% versus 8.1% expected. To curb inflation, central banks worldwide have been raising interest rates, with the Federal Reserve expected to raise by 0.75% later this week. Despite good intentions, the World Bank is warning of a potential global recession if rates rise too high, claiming that synchronous tightening could compound effects as each country implements aggressive monetary policy. Please see Chart 1 for historical Core and Overall CPI inflation data, and Chart 2 for contributions to inflation. 

Chart 1: Consumer-price index, change from a year earlier. 

Chart 2: Contributions to inflation 

U.S. Retail Sales rose 0.3% in August, which marks a reversal from July’s print of -0.4%. This reversal is likely driven by decreases in gas prices across the country. Remember that gas and oil are inputs for basically every good you can possibly purchase. As prices come down, costs to produce and transport goods do as well, not to mention consumers having more disposable income based on what they save at the pump. For historical month-over-month retail sales data, please see Chart 3.  

Chart 3: Month-over-month change in retail sales 

What to Watch 

  • U.S. Retail Gas Price on Sept. 19th at 4:30 PM EST. 
  • U.S. Housing Starts and U.S. Housing Starts Month over Month on Sept. 20th at 8:30 AM EST. 
  • U.S. Existing Home Sales and US Existing Home Sales Month over Month on Sept. 21st at 10:00 AM EST. 
  • Target Fed Funds Rate on Sept. 21st at 2:15 PM EST. 
  • U.S. Initial Claims for Unemployment on Sept. 22nd at 8:30 AM EST. 
  • 30-Year Mortgage Rate on Sept. 22nd at 10:00 AM EST. 

Summary 
Although inflation was higher than expected, it’s important to remember that last week’s print still shows signs of improvement over the prior month. Additionally, global concerns continue to dominate the news, such as Russia/Ukraine, Chinese quarantined cities, and the energy crisis in Europe. While there are concerns of a global recession, the United States still exhibits a strong labor market and healthy consumer financials which should help maximize economic rebound potential through the end of the year. 

The Numbers & “Heat Map”

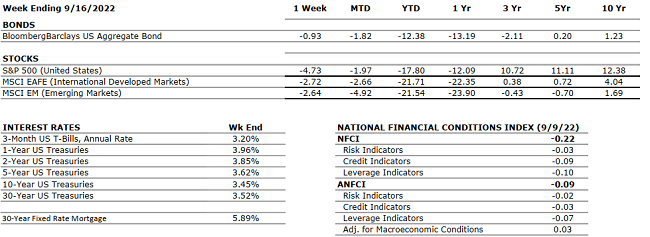
THE NUMBERS

The Sources: Index Returns: Morningstar Workstation. Past performance is no guarantee of future results. Indices are unmanaged and cannot be invested into directly. Three, five and ten year returns are annualized. Interest Rates: Federal Reserve, Mortgage Bankers Association.

MARKET HEAT MAP
The health of the economy is a key driver of long-term returns in the stock market. Below, we assess the key economic conditions that we believe are of particular importance to investors.

US ECONOMY

CONSUMER HEALTH

NEUTRAL

Q1 2022 Real GDP shrunk at a 1.6% annual rate. The main factors that resulted in a decrease in GDP were a surge in imports and trade deficit highlighting that the U.S. is buying more goods from foreign countries. According to the second estimate, real GDP for Q2 2022 decreased at an annual rate of 0.6% (up from the first estimate of -0.9%) marking the second consecutive quarter of declining GDP.

CORPORATE EARNINGS

NEUTRAL

The earnings growth rate for Q2 2022 was 6.7% (up from previous estimates of 4.3%) which marked a new post-pandemic low; but still solidly in the “growth” stage. The estimated growth rate for Q3 2022 is 3.5%, which was adjusted downward from 9.8% in June.

EMPLOYMENT

NEUTRAL

U.S. Nonfarm Payrolls for August 2022 increased by 315,000 and the unemployment rate for August rose slightly to 3.7% compared to 3.5% in July. Professional and business services, health care, and retail trade were among the sectors with the most notable job gains.

INFLATION

NEGATIVE

The annual inflation rate in the U.S. increased by 8.3% for August 2022 — below the 8.5% in July but above the expected 8.1%. Food prices saw the largest increases since 1979 (11.4%), shelter and used cars also impacted inflation significantly. Core CPI increased 6.3% year-over-year, the most since March, and up from 5.9% in both June and July.

FISCAL POLICY

NEUTRAL

Senator Manchin and Majority Leader Schumer reached an agreement on the latest tax and energy bill with incentives for green energy, electric cars, and conversely oil & gas companies for exploration. No changes in private equity taxes or higher tax rates for the very wealthy were enacted. The bill has been officially passed by the Senate. Last week, President Biden announced student loan forgiveness of up to $20,000 subject to income limitations.

MONETARY POLICY

NEGATIVE

With inflation still running hot, Fed Chairman Jay Powell is clear on his path to slow the economy enough to cool inflation. This plan has been reiterated at the Jackson Hole symposium. The next Fed meeting is September 20-21 and markets are pricing in another 0.50-0.75% increase in short- term rates to continue to battle inflation.

GLOBAL CONSIDERATIONS

GEOPOLITICAL RISKS

NEGATIVE

Russia has defaulted on its debt as of late June for the first time since 1918. Sanctions imposed by Western powers effectively isolated Russia and its financial system from Europe and the U.S. making it much harder for Russia to complete international financial transactions. On a good note – Israel and Turkey have restored diplomatic ties and will be exchanging ambassadors again after four years. This should result in a significant improvement in regional stability.

ECONOMIC RISKS

NEGATIVE

COVID-19 lockdowns in China are persistent and the ongoing Russian-Ukraine war is causing a major energy crisis in Europe. Putin shut down the pipeline that supplies Europe with natural gas indefinitely until all sanctions affecting Russia are lifted. European countries are struggling to find alternative energy resources and are starting to implement significant restrictions on the use of energy in households and businesses.

The “Heat Map” is a subjective analysis based upon metrics that VNFA’s investment committee believes are important to financial markets and the economy. The “Heat Map” is designed for informational purposes only and is not intended for use as a basis for investment decisions.