Current Market Observations

by William Henderson, Vice President / Head of Investments
Equity markets began the year with a dose of volatility that was largely absent in 2021; with all three indexes selling off and U.S. Treasury yields rising leaving investors with few places to shelter from the storm. The Dow Jones Industrial Average lost a respectable –0.3%, the S&P 500 Index lost –1.8%, and the NASDAQ got walloped dropping –4.5%. All the news that was fit to print was bad for the markets and the headlines were dominated by the Fed and the release of the minutes from the December 2021 FOMC meeting. The minutes revealed a Fed not only willing to taper bond purchases and raise rates in 2022 but one also willing to begin some serious balance sheet management. This sent the yield on the benchmark 10-Year U.S Treasury higher by 40 basis points to 1.75%. The Fed’s attention to its balance sheet should not be considered shocking in our view as you look at how large balances have grown even since the Great Financial Crisis of 2008 and before the pandemic. (See the chart below from the Federal Reserve Bank of St. Louis.) 
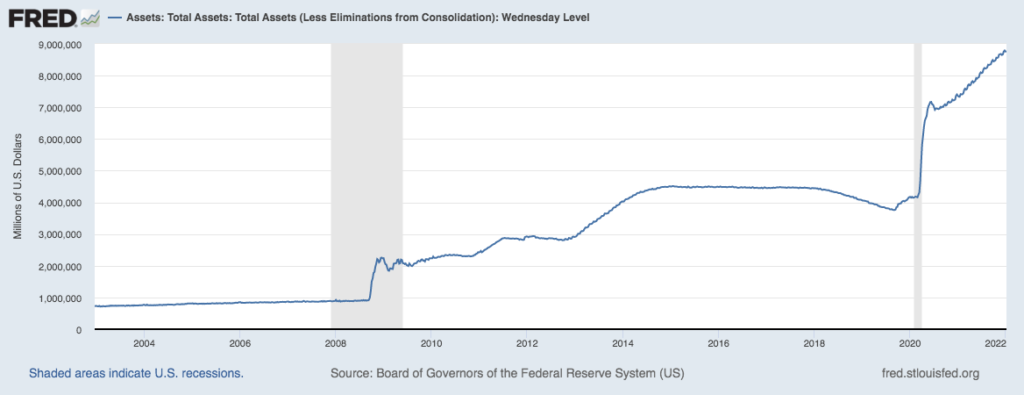
Certainly, a Fed relying more heavily on balance-sheet reduction, which in turn removes liquidity from the market as the largest buyer of bonds slows its process, although this action alone may not be all bad for markets. With this action, the Fed could focus more on its balance sheet and less on rate hikes as a way of removing monetary stimulus. Lower short-term interest rates allow for a steeper yield curve (the measure of rates between short-term levels and long-term levels); which generally is good for financial firms and banks and therefore the overall economy.

Last week’s market moves were impactful, but this same movie played early last year, and Wall Street strategists prognosticated the great growth-to-value rotation in equity markets. Yet, by the end of the year, markets moved closer to parity and all three major indexes posted strong gains for the full year. Three times since the pandemic interest rates rose sharply in a brief time followed by a sell-off in growth stocks and the NASDAQ. (See the chart below from FactSet)  
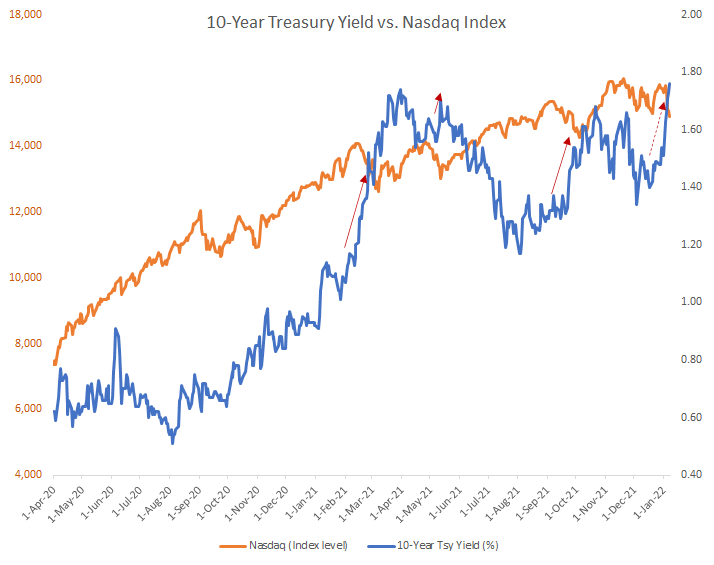
Generally, the technology heavy NASDAQ sees higher rates as a headwind to upward performance. This is true because technology firms typically borrow more than established firms and therefore higher rates affect future performance, due to increased borrowing expenses. Besides the obvious relationship between rates and growth, this chart also shows that these selloffs tend to be brief and often create a window to buy technology and growth sectors at more reasonable prices.

2022 looks to be a year with more volatility and uncertainty than 2021. You will hear the phrase “All Eyes on the Fed” about 1,000 times this year as Wall Street tries to decipher the FOMC dot plots and tea leaves of Fed minutes and comments made by Chairman Jay Powell at his press conferences. It is understood that monetary policy whether in the form of higher rates, less bond purchases or balance sheet management must be adjusted to reflect recent strong inflation data and an unemployment level reaching 3.9%. Fiscal policy seems in flux as well, as President Biden’s Build Back Better plan flounders in Washington with each passing week. This leaves us with the consumer and the corporation to propel the economy alone. That’s not a bad picture when you consider both are very healthy with strong balance sheets, healthy cash positions and relatively low interest rates.  

This week we will get a good amount of economic data with inflation (CPI) coming out Wednesday, unemployment level on Thursday and retail sales and consumer confidence on Friday. “All Eyes on the Fed”?  We say all eyes on the consumer.

The Number & “Heat Map”

THE NUMBERS
Sources: Index Returns: Morningstar Workstation. Past performance is no guarantee of future results. Indices are unmanaged and cannot be invested into directly. Three, five and ten year returns are annualized. Interest Rates: Federal Reserve, Mortgage Bankers Association.

MARKET HEAT MAP
The health of the economy is a key driver of long-term returns in the stock market. Below, we assess the key economic conditions that we believe are of particular importance to investors.

US ECONOMY

CONSUMER HEALTH

POSITIVE

U.S. GDP growth decelerated to a 2% annualized pace in Q3. The slowdown was driven primarily by supply chain constraints. Economists expect a modest acceleration in Q4. Early high-frequency data (shopping, travel, movie ticket sales) is showing some slowing. Holiday retails sales numbers will be important to gauge consumer behavior.

CORPORATE EARNINGS

POSITIVE

Fourth quarter wrapped up and earnings are likely to be impacted by labor, supply shortages, price increases and wage inflation. As EPS estimates are ironed out each of these items will play a role, some greater than others. Watch for increases but at a muted pace.

EMPLOYMENT

POSITIVE

Although December increase in payrolls did not meet expectations (199,000 jobs added versus 422,000 expected), the unemployment rate fell to 3.9% versus an expected 4.1%. Wages increased more than expected at 4.7% year-over-year. Strong recovery in leisure and hospitality which had the biggest gain by industry and accounted for more than 25% of all jobs added in December (55,000).

INFLATION

NEGATIVE

CPI rose 6.8% year-over-year in November, the highest increase since 1982, driven by the global supply chain backlog and continued consumer pent up demand. Will inflation be transitory or permanent? Goldman Sachs capital market assumption forecast CPI at an average of 3.1% for 2022 suggesting a significant decrease in inflation from the current 6.8%. Updated inflation numbers for December to be released on January 12th.

FISCAL POLICY

NEUTRAL

The Build Back Better Bill has been pushed into 2022 in a scaled back $1.8 trillion version as Senator Manchin continues to hold back support. The economy seems to be digesting a new world where fiscal policy is no longer considered an economic stimulus.

MONETARY POLICY

NEUTRAL

Fed discussed a triple threat of tightening: raise interest rates, halt purchases, and reduce its balance sheet (reducing holdings of Treasurys and mortgage-backed securities). Gradual and steady reduction of liquidity will be key in preserving market performance (fast and sudden changes would most likely result in panic-driven sell offs). Expect three rate hikes in 2022 beginning in March.

GLOBAL CONSIDERATIONS

GEOPOLITICAL RISKS

NEUTRAL

The new omicron COVID-19 variant has shown up in many parts of the world. This strain seems less virulent and more reactive to boosters so its impact it still yet to be calculated. A rebound in travel and leisure now seems unsure. Important to watch the Russia/Ukraine situation.

ECONOMIC RISKS

NEUTRAL

Supply chain disruptions are hampering the economy; however, demand remains very strong. While global logistics are operating far below normal efficacy, it appears the supply chain is slowly improving and may reach normalcy by mid-to-late-2022.

The “Heat Map” is a subjective analysis based upon metrics that VNFA’s investment committee believes are important to financial markets and the economy. The “Heat Map” is designed for informational purposes only and is not intended for use as a basis for investment decisions.

“Your Financial Choices”

Tune in Wednesday, 6 PM for “Your Financial Choices” with Laurie Siebert on WDIY 88.1FM. Laurie welcomes William Henderson, VP/Head of Investments at VNFA to discuss: 2021 Review & 2022 Outlook

Laurie can address questions on the air that are submitted either in advance or during the live show via yourfinancialchoices.com. Recordings of past shows are available to listen or download at both yourfinancialchoices.com and wdiy.org.

Tax Corner

Fourth quarter estimated tax payments are due January 18, 2022.  These estimates may include federal, state and/or local vouchers depending on your situation.

If quarterly estimates were recommended when we prepared your 2020 return, they would be included with your tax return. If you requested a paper client copy of your return, the instructions, vouchers and envelopes were included with your tax folder. If you requested an electronic client copy, the instructions and vouchers were included in both the client copy and action needed copy posted to your client portal. 

Please follow the applicable instructions previously provided to mail your payment and voucher by January 18, 2022.

There may be situations where the estimates were generated, but an overpayment was applied in full or in part. If your income or withholdings have significantly changed since last year, please contact your tax preparer to review. If you change or do not make the estimates, please let your tax preparer know at tax filing time.

VNFA NEWS

Given the recent rapid spread of the omicron variant and the addition of potential exposures over the holidays, this week most of our team will be working remotely. Our offices will be open for scheduled appointments and deliveries during normal office hours. Our commitment to keep our team and our client safe continues to be a priority and we thank you for your understanding as we continue masking inside our office spaces in January.

Current Market Observations

by William Henderson, Vice President / Head of Investments
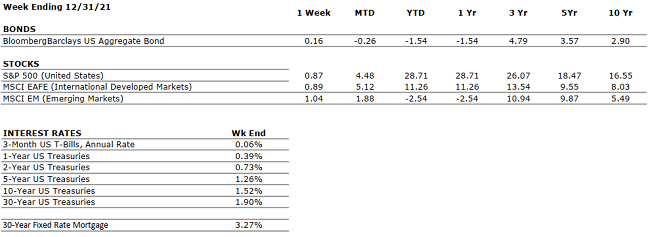
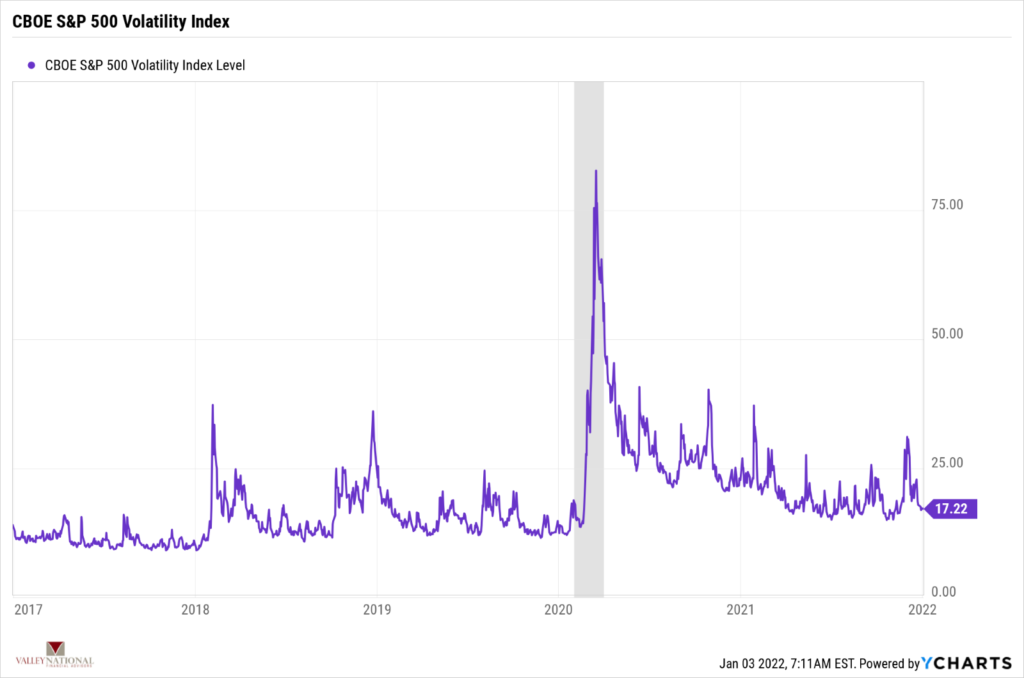
Stocks ended the year on a mixed note with the broader markets posting modest gains while the technology-laden NASDAQ notched a barely noticeable loss. The Dow Jones Industrial Average rose +1.1%, the S&P 500 Index gained +0.9%, and the NASDAQ dropped –0.1%. Massive piles of cash in consumer coffers, corporate earnings hitting new records, and waning but still in place federal monetary and fiscal stimulus propelled markets to new records in 2021 and the patient investor was richly rewarded with double-digit full year 2021 returns in all three major market indexes. Year-to-date 2021, the Dow Jones Industrial Average has returned +21.0%, the S&P 500 Index +28.7% and the NASDAQ +22.2%. What made the returns in equities more palatable was that these returns were garnered with very little volatility. A brief look at the VIX (Chicago Board of Options Exchange S&P 500 Volatility Index), which measure stock market volatility shows that by historic measures the VIX in 2021 was calm. See the chart below from YCharts and Valley National Financial Advisors. There were very few spikes in the VIX above 25, and for most of the year, the index was modestly falling.   

During this record rise in stock prices, fixed-income markets, while selling off early in 2021, regained some composure mid-year and stayed relatively steady into year-end.  he 10-year U.S. Treasury opened 2021 at a yield of 0.91%, hit a high of 1.74% in March and then closed the year at 1.51%. While not a year for strong bond returns, for the few occasions in 2021 when risk assets sold off, it was important that smart investors held anchor positions in risk management assets like bonds. 

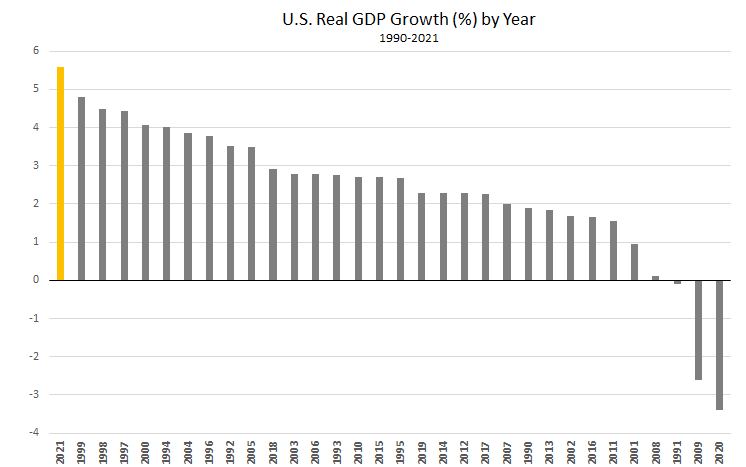
As mentioned, corporate earnings were strong, reflecting economic growth that was the strongest since 1984. (See the chart below from Factset.) 

The Fed successfully orchestrated a recovery from the pandemic-induced recession of 2020, which gave consumers the confidence to spend on everything from leisure activities to new homes and renovations to existing homes. While inflation became a concern along with supply chains disruptions, labor markets were hot all year and unemployment slowly fell to 4.2% as hiring continued across all sectors of the economy.   

As we look to 2022, there are headwinds and tailwinds to consider. While monetary stimulus will slowly get removed as the Fed reduces its bond buying and then moves to higher interest rates, fiscal stimulus could continue in the form of big policy spending like the Biden-proposed $1.8 trillion Build Back Better Bill. The consumer starts the year in excellent financial shape bolstered by strong increases in savings accounts and limited spending in 2021. Corporate balance sheets are also in excellent shape allowing firms to boost wages and hiring but supply chain disruptions and drastic increases in raw material costs pose dilemmas for corporate CEOs. Wall Street economists are modestly optimistic on 2022 with growth estimates for U.S. GDP averaging +3.0% which certainly provides a solid base that supports the continuation of the bull market.   Stay focused on the tailwinds while being aware of the headwinds and keep a long-term perspective on your investments and your financial plan. 

The Numbers & “Heat Map”

THE NUMBERS
Sources: Index Returns: Morningstar Workstation. Past performance is no guarantee of future results. Indices are unmanaged and cannot be invested into directly. Three, five and ten year returns are annualized. Interest Rates: Federal Reserve, Mortgage Bankers Association.

MARKET HEAT MAP
The health of the economy is a key driver of long-term returns in the stock market. Below, we assess the key economic conditions that we believe are of particular importance to investors.

US ECONOMY

CONSUMER HEALTH

POSITIVE

U.S. GDP growth decelerated to a 2% annualized pace in Q3. The slowdown was driven primarily by supply chain constraints. Economists expect a modest acceleration in Q4. Early high-frequency data (shopping, travel, movie ticket sales) is showing some slowing. Holiday retails sales numbers will be important to gauge consumer behavior.

CORPORATE EARNINGS

POSITIVE

Fourth quarter wrapped up and earnings are likely to be impacted by labor, supply shortages, price increases and wage inflation. As EPS estimates are ironed out each of these items will play a role, some greater than others. Watch for increases but at a muted pace.

EMPLOYMENT

POSITIVE

The unemployment rate is down to 4.2%, as of November. The labor market is very tight at present as many employers, particularly in the Leisure and Logistics sectors, are struggling to fully staff because the labor participation rate remains below pre-COVID levels. The labor shortage is one of the causes of the global supply chain glut.

INFLATION

NEGATIVE

CPI rose 6.8% year-over-year in November, the highest increase since 1982, driven by the global supply chain backlog and continued consumer pent up demand. Will inflation be transitory or permanent? Powell may remove “transitory” from his testimony this week.

FISCAL POLICY

NEUTRAL

The Build Back Better Bill has been pushed into 2022 in a scaled back $1.8 trillion version as Senator Manchin continues to hold back support. The economy seems to be digesting a new world where fiscal policy is no longer considered an economic stimulus.

MONETARY POLICY

POSITIVE

By early 2022, all Fed bond purchases will halt. The Fed’s bond buying program works to keep interest rates low. Once tapering ends, rate hikes follow. Mid-June or sooner for rate hike?

GLOBAL CONSIDERATIONS

GEOPOLITICAL RISKS

NEUTRAL

The new omicron COVID-19 variant has shown up in many parts of the world. This strain seems less virulent and more reactive to boosters so its impact it still yet to be calculated. A rebound in travel and leisure now seems unsure. Important to watch the Russia/Ukraine situation.

ECONOMIC RISKS

NEUTRAL

Supply chain disruptions are hampering the economy; however, demand remains very strong. While global logistics are operating far below normal efficacy, it appears the supply chain is slowly improving and may reach normalcy by mid-to-late-2022.

The “Heat Map” is a subjective analysis based upon metrics that VNFA’s investment committee believes are important to financial markets and the economy. The “Heat Map” is designed for informational purposes only and is not intended for use as a basis for investment decisions.

Tax Corner

Get ready to file your 2021 income tax return by planning ahead. The IRS has resources at irs.gov like “Steps to Take Now to Get a Jump on Your Taxes.”

Changes to VNFA Tax Process
Our Tax Department continues to roll out efficiencies to make the tax preparation process easier for our clients. New this year, we will be sending tax preparation clients a combined packet with engagement, questionnaire, and personalized organizers with document checklists. These will be distributed later in January and should be used as a guide when collecting tax source documents. The combined packet should be complete and returned with your tax source documents, and not before. We look forward to sharing more innovative updates with you as 2022 unfolds.