Did You Know…?

News for Educators & Student Loan Borrowers

The IRS announced that eligible educators can deduct unreimbursed expenses for COVID-19 protective items to stop the spread of COVID-19 in the classroom. READ MORE

The Department of Education announced that President Biden extended the student loan payment pause and interest waiver “at least” through September 30, 2021. READ MORE

Current Market Observations

by William Henderson, Vice President / Head of Investments
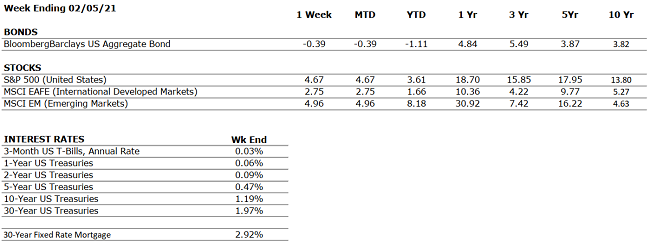
Investors shrugged off economic setbacks such as a weaker than expected jobs report and pushed stocks higher by the end of the week hitting new records across the board. Additionally, Janet Yellen, the newly installed Treasury Secretary, pushed for rapid fiscal stimulus while ignoring the potential for inflation. Such dovish commentary pushed the 10-year U.S. Treasury note to 1.15% by the end of last week.  For the week that ended February 5, 2021, the Dow Jones Industrial Average returned +3.9%, the S&P 500 Index +4.7% and the NASDAQ +6.0%. The strong returns from last week moved the averages well into positive territory for the year; with the Dow Jones Industrial Average returning +1.9%, S&P 500 Index +3.6% and the NASDAQ at +7.6%. As noted above, the 10-year U.S. Treasury note moved higher by eight basis points to 1.15%.   

With the modest rise in Treasury yields, the yield curve, the slope of which gives an idea of future interest rates and economic activity, is at its steepest since 2017. The steepening yield curve signals comfort by Treasury and Fed that the economy is healing and expectations of upcoming healthy inflation. While making the case for President Biden’s $1.9 trillion economic relief package, Treasury Secretary Yellen noted on CNN February 7 that “too rapid inflation was a risk that needed to be considered and that policy makers have the tools to deal with that should it materialize.” 

Other than the slightly weaker January payroll report of only +49,000 new jobs added, there were plenty of positive economic reports last week. The Institute for Supply Management’s service survey topped expectations and the new-order and hiring components pointed to stronger growth ahead and durable-goods orders topped expectation as well. The economy will get a healthy boost from more stimulus payments, if not from a bipartisan effort than from the Democrats own $1.9 trillion package. The final driving power behind last week’s rally in the markets was improving Covid-19 news. The weekly number of new cases continued to drop and new vaccines, including one from Johnson & Johnson, will be on the scene soon.   

With some much noise from the media, investors oftentimes lose sight of the long-term objective which is saving for retirement or another similar financial goal. In contrast, clear financial goals, a disciplined investment process and a long-term approach is how investors can achieve their objectives. 

The Numbers & “Heat Map”

THE NUMBERS
Sources: Index Returns: Morningstar Workstation. Past performance is no guarantee of future results. Indices are unmanaged and cannot be invested into directly. Three, five and ten year returns are annualized. Interest Rates: Federal Reserve, Mortgage Bankers Association.

MARKET HEAT MAP
The health of the economy is a key driver of long-term returns in the stock market. Below, we assess the key economic conditions that we believe are of particular importance to investors.

US ECONOMY

CONSUMER HEALTH

NEUTRAL

U.S. GDP increased at a 4% annualized rate in Q4. For the full-year 2020, the U.S. economy contracted by 3.5%, its worst performance since 1946. GDP is expected to improve meaningfully in 2021 as the American population gets vaccinated.

CORPORATE EARNINGS

NEUTRAL

With ~60% of S&P 500 constituents having reported Q4 earnings, profit growth is coming in at 1.6% year-over-year, well in excess of analyst expectations, which figured that earnings would fall by 7%.

EMPLOYMENT

NEGATIVE

The unemployment rate declined to 6.3% in January from 6.7% in December. Labor weakness remains in sectors such as Leisure and Travel; such sectors stand to benefit as vaccine distribution accelerates.

INFLATION

POSITIVE

The Fed plans to allow inflation to temporarily overshoot its 2% target such that the long-term average is 2%. Inflation has been tame since the Great Financial Crisis, less than 2%.

FISCAL POLICY

POSITIVE

Discussions on President Biden’s a $1.9 trillion stimulus package are ongoing. If the bill passes through Congress, the U.S. economy will have received a total of approximately $4 trillion in stimulus over the trailing twelve months.

MONETARY POLICY

VERY POSITIVE

The Federal Reserve supported asset markets with unprecedented speed and magnitude in response to COVID-19.

GLOBAL CONSIDERATIONS

GEOPOLITICAL RISKS

NEUTRAL

There are few, if any, looming geopolitical risks that could upset the economic recovery.

ECONOMIC RISKS

NEUTRAL

Although economic activity mostly remains below 2019’s levels, improvement has occurred across nearly every measure since the April 2020 nadir. With multiple vaccines in distribution, a second fiscal package in place, and interest rates low, 2021 is positioning to be a strong economic year.

The “Heat Map” is a subjective analysis based upon metrics that VNFA’s investment committee believes are important to financial markets and the economy. The “Heat Map” is designed for informational purposes only and is not intended for use as a basis for investment decisions.

“Your Financial Choices”

Tune in Wednesday, 6 PM for “Your Financial Choices” show on WDIY 88.1FM: Attorney Nicholas Sandercock from Gross McGinley, LLP, joins Laurie to discuss: Contracts – the ins and outs of offer, acceptance and consideration

Laurie and her guest can take your questions live on the air at 610-758-8810, or address those submitted via  yourfinancialchoices.com. Recordings of past shows are available to listen or download at both yourfinancialchoices.com and wdiy.org.

VNFA NEWS

VNFA Tax Department
Please know that VNFA operates as a TEAM.

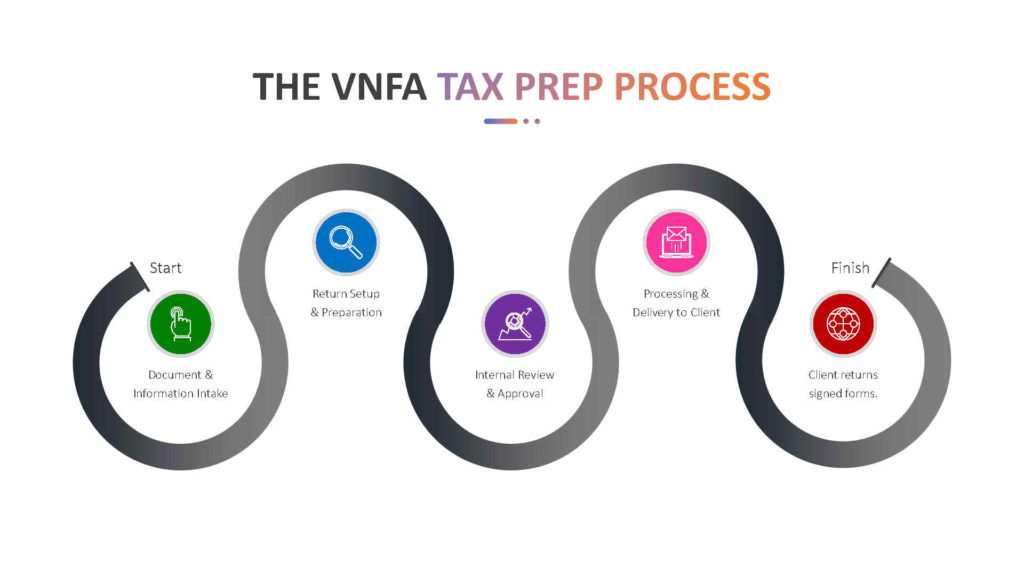
While anyone in our offices will be able to help you, our Tax Department staff is specifically trained to manage the tax filing season process. The VNFA Tax Department is a group of service specialists and CPAs who all work in direct communication with your financial advisor and supporting team. To contact the Tax Department, e-mail tax@valleynationalgroup.com.

Starting in early February, members of our Tax Department will be available in our Bethlehem headquarters on a rotating schedule, and remotely during normal business hours. Please let us know when you call to make an appointment for document delivery if you will need to speak with one of our tax professionals, or if we need to arrange for someone from your financial advisory service team to be available via phone or video conference.

Our tax preparation process for clients is unchanged, and we encourage you to complete your Tax Questionnaire as soon as possible in advance of providing us with your complete package of supporting tax documents. Digital delivery is preferred as we maintain the safety of our team and clients as our #1 goal. Forms and instructions can be found on our website: valleynationalgroup.com/tax.

Did You Know? TAX TIP

April 15 is the tax deadline, and it will not be extended. Our Tax Department recommends that clients don’t delay based on rumors or predictions of another extended filing deadline as it was in 2020. The decision by the IRS to postpone acceptance of tax returns until February 12 will have no affect on the final filing deadlines. Read more from a recent MSN Money article – IRS Delays Opening of Tax Season, but What About the April 15 Deadline? (msn.com)

For instructions, access to online forms and answers about how to securely deliver your tax documents to us, please visit our website at valleynationalgroup.com/tax or send inquiries to tax@valleynationalgroup.com

Current Market Observations

by William Henderson, Vice President / Head of Investments
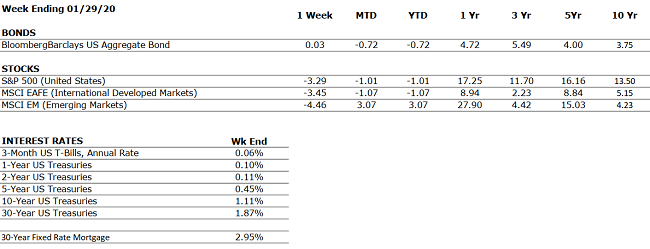
Uncertainty from Washington and continued sloppy and inefficient roll out of the COVID-19 vaccine put pressure on the markets last week and all three major averages posted negative returns for the week. The Dow Jones Industrial Average returned -3.3%, the S&P 500 Index -3.3% and the NASDAQ -3.5%. The returns from last week moved the averages into mixed territory year to date. With the Dow Jones Industrial Average and S&P 500 Index both with negative year-to-date returns at -2.0% and -1.0% respectively, while the NASDAQ remains positive for the year at +1.4%. The 10-year U.S. Treasury note moved down two basis points to close the week at 1.07%.

President Biden’s latest stimulus plan calls for a $1.9 trillion package. The counter-offer stimulus plan from Senate Republicans called for a smaller $600 billion package. Whichever is the outcome, the result is clear, more government stimulus money is on the way to consumers and the economy.    

Economic data released last week was mixed with 4Q real GDP rising only 4.0%, which was less than the 5.5% some economists had predicted. However, capex was a strong +13.5% and housing up a stunning +33.5% for the quarter. Clearly, investment is driving the economy, and everyone is looking ahead to the successful widespread distribution of the COVID-19 vaccine. Last week, Fed Chairman Jay Powell was quoted stating the obvious to the investment community: “the key to growth will be the vaccine rollout.”   

Last week we saw some interesting trading in the markets as retail investors handed the hedge fund community losses in a few widely traded short sells. Tailwinds of consumer reserves, Fed liquidity, further government stimulus, and a successful vaccine from at least four pharmaceutical firms outweigh the economic headwinds. Stay diversified and stick to your long-term financial plan. 

The Numbers & “Heat Map”

THE NUMBERS
Sources: Index Returns: Morningstar Workstation. Past performance is no guarantee of future results. Indices are unmanaged and cannot be invested into directly. Three, five and ten year returns are annualized. Interest Rates: Federal Reserve, Mortgage Bankers Association.

MARKET HEAT MAP
The health of the economy is a key driver of long-term returns in the stock market. Below, we assess the key economic conditions that we believe are of particular importance to investors.

US ECONOMY

CONSUMER HEALTH

NEUTRAL

U.S. GDP increased at a 4% annualized rate in Q4. For the full-year 2020, the U.S. economy contracted by 3.5%, its worst performance since 1946. GDP is expected to improve meaningfully in 2021 as the American population gets vaccinated.

CORPORATE EARNINGS

NEUTRAL

Q4 earnings season is underway. Consensus estimates were that S&P 500 earnings would be down 7% year-over-year, however, companies are beating expectations – oftentimes by a wide margin – thus far.

EMPLOYMENT

NEGATIVE

The unemployment rate was stagnant in December at 6.7%. This is the first month since April in which the unemployment rate did not improve.

INFLATION

POSITIVE

The Fed plans to allow inflation to temporarily overshoot its 2% target such that the long-term average is 2%. Inflation has been tame since the Great Financial Crisis, less than 2%.

FISCAL POLICY

POSITIVE

President Biden unveiled a $1.9 trillion stimulus package last week. If the bill passes through Congress, the U.S. economy will have received a total of approximately $4 trillion in stimulus over the trailing twelve months.

MONETARY POLICY

VERY POSITIVE

The Federal Reserve supported asset markets with unprecedented speed and magnitude in response to COVID-19.

GLOBAL CONSIDERATIONS

GEOPOLITICAL RISKS

NEUTRAL

There are few, if any, looming geopolitical risks that could upset the economic recovery.

ECONOMIC RISKS

NEUTRAL

Although economic activity mostly remains below 2019’s levels, improvement has occurred across nearly every measure since the April 2020 nadir. With multiple vaccines in distribution, a second fiscal package in place, and interest rates low, 2021 is positioning to be a strong economic year.

The “Heat Map” is a subjective analysis based upon metrics that VNFA’s investment committee believes are important to financial markets and the economy. The “Heat Map” is designed for informational purposes only and is not intended for use as a basis for investment decisions.