
THE NUMBERS
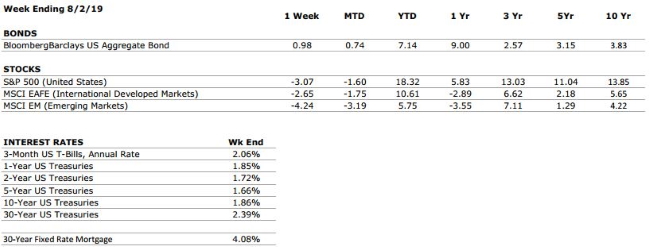 Sources: Index Returns: Morningstar Workstation. Past performance is no guarantee of future results. Indices are unmanaged and cannot be invested into directly. Three, five and ten year returns are annualized excluding dividends. Interest Rates: Federal Reserve, Freddie Mac
US ECONOMIC HEAT MAP
The health of the US economy is a key driver of long-term returns in the stock market. Below, we grade 5 key economic conditions that we believe are of particular importance to investors.
|
CONSUMER SPENDING |
A |
Our consumer spending grade remains an A. Surveys of US consumers continue to indicate that the consumer is in a strong position, and recent GDP data provided further evidence of healthy consumer spending. |
|
FED POLICIES |
B+ |
Our Fed Policies grade remains a B+ after the Federal Reserve opted to cut its interest rate target by 25 bps following last week’s meeting. The cut was widely anticipated by markets, and if history is any representation, it is unlikely to be the last. |
|
BUSINESS PROFITABILITY |
B- |
With 77% of S&P 500 companies having reported earnings as of August 2, the EPS growth rate for the second quarter is -1%. If that number holds up, we will have observed two consecutive quarters of year-over-year earnings declines for the first time since 2016. |
|
EMPLOYMENT |
A |
The US economy added 224,000 new jobs in June, beating consensus estimates by a wide margin. We continue to view the jobs market as very healthy. |
|
INFLATION |
B |
Inflation is often a sign of “tightening” in the economy, and can be a signal that growth is peaking. The inflation rate remains benign at this time, but as the economic cycle continues to mature, this metric will deserve our ongoing attention. |
|
OTHER CONCERNS |
||
|
INTERNATIONAL RISKS |
6 |
On a 10 point scale, we currently assess the “international risks” to markets as a 6. The key areas of focus for markets remain US/China trade relations, the ongoing Brexit negotiations, and escalating tensions in the Middle East. |
The “Heat Map” is a subjective analysis based upon metrics that VNFA’s investment committee believes are important to financial markets and the economy. The “Heat Map” is designed for informational purposes only and is not intended for use as a basis for investment decisions.