We’re Hiring! Our team is seeking an experienced full-time Financial Planner to work with our ExecutiveEdgeTM Financial Advisors. This non-administrative position requires an understanding of executive benefits to support our high-profile corporate client relationships. READ MORE / APPLY ONLINE
Our Associate Financial Advisor Jessica Goedtel, CFP was interviewed by
CNBC for an article about balancing student loan debt and retirement savings. READ
MORE
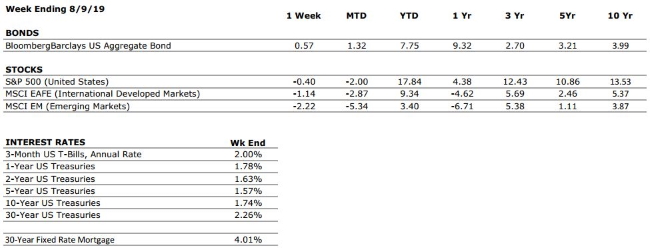
THE NUMBERS Sources: Index Returns: Morningstar Workstation. Past performance is no guarantee of future results. Indices are unmanaged and cannot be invested into directly. Three, five and ten year returns are annualized excluding dividends. Interest Rates: Federal Reserve, Freddie Mac
US ECONOMIC HEAT MAP
The health of the US economy is a key driver of long-term returns in the stock market. Below, we grade 5 key economic conditions that we believe are of particular importance to investors.
CONSUMER SPENDING
A
Our consumer spending grade remains an A. Surveys of US consumers continue to indicate that the consumer is in a strong position, and recent GDP data provided further evidence of healthy consumer spending.
FED POLICIES
B+
Our Fed Policies grade remains a B+ after the Federal Reserve opted to cut its interest rate target by 25 bps following last month’s meeting. The cut was widely anticipated by markets, and if history is any representation, it is unlikely to be the last.
BUSINESS PROFITABILITY
B-
According to Factset, with 90% of S&P 500 companies having reported earnings as of August 9, the EPS growth rate for the second quarter is -0.7%. Despite the weak growth rate (which partially stems from difficult year-over-year comparisons), almost 75% of companies have beaten consensus estimates this quarter.
EMPLOYMENT
A
The US economy added 164,000 new jobs in July, right on target with consensus expectations. July’s report also showed that the size of the labor force (defined as those who are either working or actively seeking employment) grew to its highest level ever. The labor market remains one of the strongest components of the US economy.
INFLATION
B
Inflation is often a sign of “tightening” in the economy, and can be a signal that growth is peaking. The inflation rate remains benign at this time, but as the economic cycle continues to mature, this metric will deserve our ongoing attention.
OTHER CONCERNS
INTERNATIONAL RISKS
7
Following a re-escalation of the US/China trade dispute, we have raised our “international risks” metric back to a 7. Other key areas of focus for markets include the ongoing Brexit negotiations, rising economic nationalism around the globe, and escalating tensions in the Middle East.
The “Heat Map” is a subjective analysis based upon metrics that VNFA’s investment committee believes are important to financial markets and the economy. The “Heat Map” is designed for informational purposes only and is not intended for use as a basis for investment decisions.
by Connor Darrell CFA, Assistant Vice President – Head of Investments Global equities ended the week modestly lower after recouping some of Monday’s sharp losses. A re-escalation of trade tensions dominated the attention of markets for most of the week, as China allowed its currency to decline to its lowest level against the dollar in over a decade. The move has been widely viewed as a response to President Trump’s announcement of a new round of tariffs (a weaker currency makes Chinese goods more affordable for foreign buyers) scheduled to go into effect in September. Bond yields continued their downward trend as the equity market volatility led investors to seek the relative safety of U.S. Treasuries, which still offer attractive yields in comparison to those available in much of the developed world. In many places around the world, bond investors are faced with negative yields. At present, a record $15 trillion of bonds around the world now carry negative interest rates.
How Do Currency Valuations Affect Investors? The sudden decline in the value of the Chinese Yuan that followed President Trump’s announcement of a new round of tariffs led many in the administration to label China a “currency manipulator,” a term which was not being used to describe Chinese economic policy for the first time. The rising tensions have increased market volatility and altered the market’s perception of risk, causing safe haven assets such as U.S. Treasuries to rally further.
We often think of our portfolios as
being comprised of stocks and bonds, and rarely do we have direct positions in
foreign currencies, but it is important for long-term investors to understand
how exchange rates fit into the bigger picture.
In general, foreign exchange rates are a byproduct of the economic
backdrop. All else equal, a country with a healthier economy, higher interest
rates, and a stronger balance sheet will have a more valuable currency. This is
why we have seen the dollar continue to appreciate throughout much of the last
several years. The flip side of the coin for large multi-national corporations
is that a stronger dollar may weaken reported sales and earnings because its
products become more expensive to foreign customers. This is part of the reason
we have seen a tapering of earnings growth for U.S. companies during recent
quarters.
The strength of the dollar may
continue to cause headwinds for large multi-national corporations, but in
general, it is a representation of the relative strength of the U.S. economy
and should not be overly concerning for investors. The more challenging
phenomenon for many investors who may require income generation from their
portfolios is that the recent moves have led to increased volatility in markets
and have pushed bond yields even lower. In a low-yield environment, it can be
tempting for bond investors to seek out more risky assets such as high-yield
bonds and the debt of governments located in emerging markets. However, despite
their more attractive yields, these investments offer much less protection
during market downturns. It will be important for many investors to avoid the
temptation to load up on these types of investments and to maintain a healthy
allocation to core, high quality bonds due to their ability to provide a
counterbalancing effect to equity risks within a diversified global portfolio.