Join us in celebrating our Assistant Vice President of Human Resources, Ashley Santiago, SHRM-CP. She was just named among the LV Business 2022 Forty Under 40. Forty Under 40 Awards – LVB
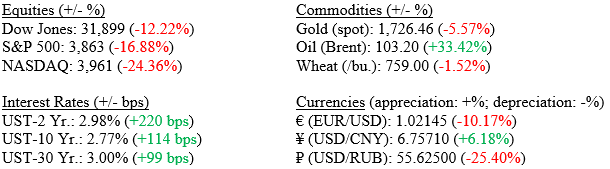
Although the market was dealt some mixed signals on the economy and earnings, overall, we ended resoundingly positive by week’s end and all three major indexes posted strong gains. Preliminary July manufacturing and services sector reports all signaled slowing business activity, notably for the U.S. services sector, conversely, Q2 earnings season kicked into a higher gear and of the 104 S&P 500 companies that have reported, 56% have topped revenue forecasts and approximately 72% have bested profit projections, per data compiled by Bloomberg. Many investors feel the best indicator of future economic growth is the stock market and that gauge helps in projecting a coming recession. Several prognosticators are predicting a recession within the next few quarters. It seems likely that we will have a technical recession (two quarters of negative Gross Domestic Product), but we believe a cyclical recession (one where there is severe employment destruction) is unlikely. We take a deep dive into several recession-related economic indicators below. For the week, the Dow Jones Industrial Average rose +2.0%, the S&P 500 Index +2.6%, and the NASDAQ moved higher by +3.3%. The 10-year U.S. Treasury Bond fell 16 basis points last week to close the week at 2.77%, once again giving investors over 1.00% for the week, and solidly inverting the yield curve.
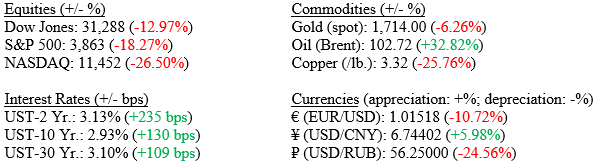
Markets (as of 7/22/2022; change YTD)
Domestic Economy
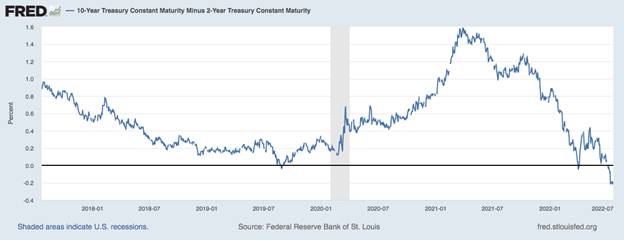
Chart 1 below (from the Federal Reserve Bank of St. Louis) shows the 10-2 Treasury yield spread, which is the difference between the 10-Year U.S. Treasury Yield and the 2-Year U.S. Treasury yield. A spread that approaches zero, or in the current market, is negative, (meaning an investor is getting less return for extending their bond’s maturity) has historically been a precursor to a recessionary period. However, the time between an inverted yield curve and a recession ranged from 6 to 24 months afterwards; meaning, this is a far-leading indicator. As noted above, the 10-Year U.S. Treasury fell again last week, hitting 2.77% down significantly from the 3.48% yield it hit in June of this year. It is likely that institutional investors who are still sitting on piles of uninvested cash saw the 10-Year U.S. Treasury yield above 3.00% compared with recent anemic levels well below 1.00% as an attractive investment and that move back into Treasuries has pushed yields lower.
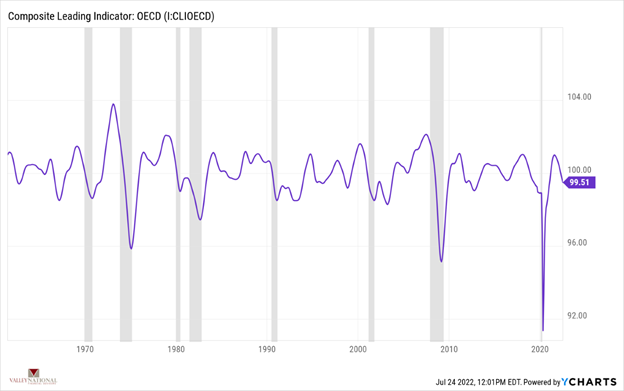
Chart 2 below (from Valley National Financial Advisors and YCharts, recessions shaded) shows the Composite of Leading Indicators by the OECD. The index is published monthly by The Conference Board. It is used to help predict the direction of global economic movements in future months. The index is composed of 10 economic components, such as: employment activity, manufacturing orders, and stock market behavior. Businesses and investors can use the index to help plan their activities around the expected performance of the economy and protect themselves from economic downturns. This indicator turned negative in September of 2021, predicting a recession was looming as every previous recession saw a sharp drop in the Composite of Leading Indicators.
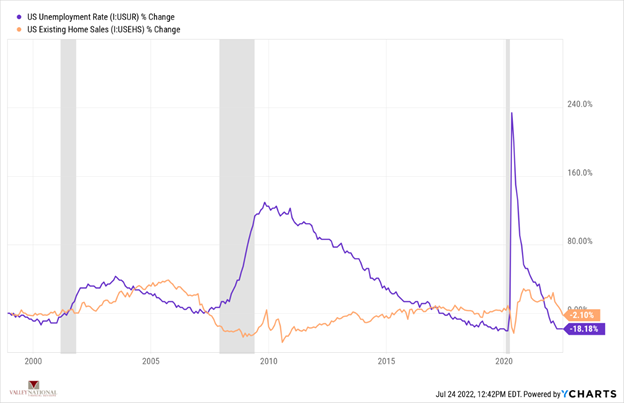
Chart 3 below (from Valley National Financial Advisors and YCharts, recessions shaded) shows U.S. Unemployment rate and U.S. Existing Home Sales charted since 2000. We see how in previous recessions unemployment rose dramatically and home sales slowed. Currently, we have the opposite where unemployment is at an historic low of 3.6% and home sales, while slowing a bit due to recently higher mortgage rates, are still strong. With these two indicators continuing to refute a looming recession we believe a cyclical recession is unlikely in the near term.
Last week we showed how several measures of inflation were starting to come down. Key commodities like copper, lumber, and oil are down from recent highs and manufacturing activity is slowing. Also, gasoline prices, a critical component in everyday spending, is down from recent highs. This data suggests the FED’s path to higher rates is slowing record high inflation and is impacting the super-hot economy. We show above that housing and employment remain strong rebutting calls for a looming recession. We never fail to remind readers how important the consumer is to the U.S. economy – fully 65-75% of economic activity is related to consumer spending and the consumer remains in particularly good financial health; especially when gauged by debt levels, savings accounts and still relatively low (by historic standards) mortgages rates. Pay close attention to the stock market – the true leading indicator of economic activity. The S&P 500 Index is up 5.23% since mid-June 2022, when we continued to see a softening in inflationary data.
Policy and Politics
The FOMC meets this week and is expected to raise rates 75 – 100 basis points.
Chairman Powell’s press conference will help us understand future moves
What to Watch
U.S. New Single-Family House Sold will be released at 10:00AM ET on July 26th.
Target Federal Funds Rate Upper Limit will be announced at 2:15PM ET on July 27th.
U.S. Real 2nd Quarter GDP Quarter over Quarter will be released at 8:30am on July 28th.
U.S. PCE Price Index YoY (the FED’s preferred inflation gauge) released at 8:30am on July 29th.
THE NUMBERS The Sources: Index Returns: Morningstar Workstation. Past performance is no guarantee of future results. Indices are unmanaged and cannot be invested into directly. Three, five and ten year returns are annualized. Interest Rates: Federal Reserve, Mortgage Bankers Association.
MARKET HEAT MAP The health of the economy is a key driver of long-term returns in the stock market. Below, we assess the key economic conditions that we believe are of particular importance to investors.
US ECONOMY
CONSUMER HEALTH
NEUTRAL
Q1 2022 Real GDP shrunk at a 1.5% annual rate according to the second estimate. The main factors that resulted in a decrease in GDP were a surge in imports and trade deficit highlighting that the U.S. is buying more goods from foreign countries. The July 2022 University of Michigan Consumer Sentiment (Confidence) Index hit 51, a level not seen since 2009 during the GFC, but up slightly from the June Index level of 50, an encouraging sign.
CORPORATE EARNINGS
NEUTRAL
The earnings growth rate for Q1 2022 was 9.2% — the lowest since Q4 2020 (3.8%). This estimate was revised upward from the previous forecast of 7.1% in April. All S&P500 companies have reported earnings — 77% reported a positive EPS surprise and 73% beat revenue expectations. The estimated growth rate for Q2 2022 is now 4.3% which would mark a new post-pandemic low; but still solidly in the “growth” stage.
EMPLOYMENT
POSITIVE
Total nonfarm payroll employment rose by 370,000 in June and the unemployment rate remained constant at 3.6%. Job growth was widespread, led by gains in leisure and hospitality, manufacturing, and transportation and warehousing. Employment in retail trade declined.
INFLATION
NEGATIVE
The annual inflation rate in the US accelerated to 9.1% in June, the highest since November 1981, from 8.6% in May and above forecasts of 8.8%. Core CPI increased by 5.9%, slightly below 6% in May, but above forecasts of 5.7%. The increase in CPI was driven by major surges in food and energy prices, as food costs rose by 10.4% and energy prices by 41.6%.
FISCAL POLICY
NEUTRAL
President Biden, who is suffering from his lowest approval ratings of his term, is recovering from COVID and is likely to come out of quarantine early this week; on Capitol Hill, it is the penultimate week to make progress on the Democrats’ (beleaguered) legislative agenda before Congress breaks for summer recess and things go dark until after Labor Day.
MONETARY POLICY
NEUTRAL
The FOMC meets this week and futures markets are pricing in an 80% chance of a 0.75 basis point rate hike at the meeting. Watch for Chairman Jay Powell press conference for any new direction the Fed may hint at taking.
GLOBAL CONSIDERATIONS
GEOPOLITICAL RISKS
NEGATIVE
Russia has defaulted on its debt as of Sunday, June 26th when the 30-day grace period on $100 million of interest payments expired. This is the first Russian default since 1918. Sanctions imposed by Western powers effectively isolated Russia and its financial system from Europe and the U.S. making it much harder for Russia to complete international financial transactions.
ECONOMIC RISKS
NEUTRAL
Supply chain disruptions in the U.S. are waning but the rising cost of oil due to the Russian- Ukraine war is likely to cause additional inflationary pressures not only on gasoline prices but also on many other goods and services. Starting in June, China has started to remove some restrictions in major cities to end the COVID-19 lockdown.
The “Heat Map” is a subjective analysis based upon metrics that VNFA’s investment committee believes are important to financial markets and the economy. The “Heat Map” is designed for informational purposes only and is not intended for use as a basis for investment decisions.
Laurie can address questions on the air that are submitted either in advance or during the live show via yourfinancialchoices.com. Recordings of past shows are available to listen or download at both yourfinancialchoices.com and wdiy.org.
Welcome Solana Berrio and Lauren Kelly to Team VNFA!
Solana has joined the team in our Investment Department. She will be working with our Chief Investment Officer and other Associates on research and technology support. Solana already has experience working at VNFA as a tax and investment intern. She has a degree in Business Administration and a master’s degree in Finance from West Virginia University.
Lauren is joining us at the front desk of our Bethlehem headquarters. She will be welcoming guests and answering your phone calls. As Front Office Coordinator, Lauren will be in the office managing the day-to-day for our hybrid team members who are working onsite and remotely throughout the week. She has more than 20 years of experience in client service, account support and office administration.
Last week, our Chief Investment Officer Bill Henderson, was the guest on “Your Financial Choices” radio show. He discussed the first half of 2022 and the outlook for the remainder of the year. Listen to the recording at yourfinancialchoices.com and submit follow-up questions. LISTEN NOW
Earlier negative data on inflation (U.S. Consumer Price Index) for June 2022 +9.1% Year Over Year rocked the equity markets and pushed investors to the relative safety of U.S. Treasury bonds. However, by the end of the week, two new pieces of inflation data (Empire State Manufacturing Prices Paid and Consumer Inflation Expectations) both moved sharply lower indicating that inflation may have peaked, and the markets snapped back nicely on Friday, although not enough to end the week in positive territory. For the week, the Dow Jones Industrial Average fell –0.16%, the S&P 500 Index lost –0.93% and the NASDAQ fell –1.57%. We take a deep dive look at inflation below. The 10-Year U.S. Treasury Bond fell 16 basis points last week to close the week at 2.93% giving back investors 1.00% of return on the year.
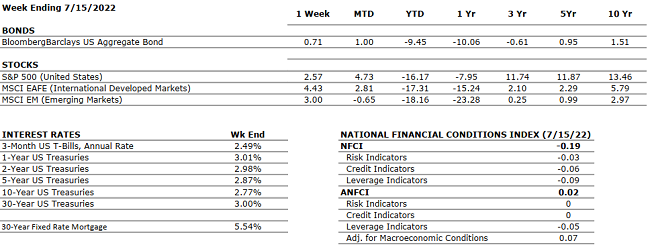
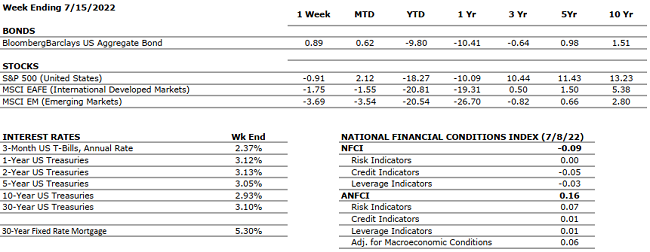
Markets (as of 7/15/2022; change YTD)
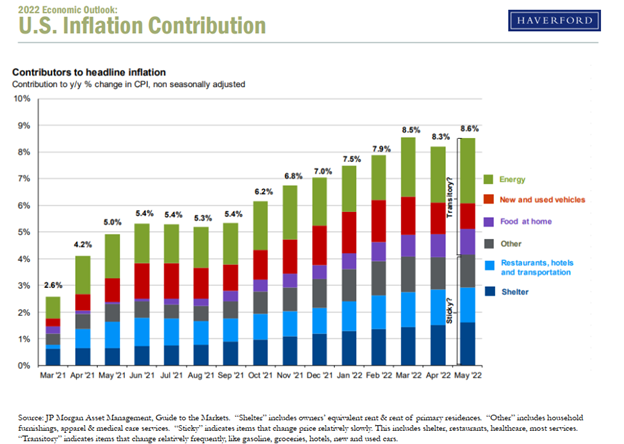
Global Economy President Biden’s trip to the Middle East will not be impacting oil prices anytime soon as he was unable to secure any reasonable increase in oil production from Saudi Arabia. A look at Chart 1 (from Haverford Trust and JP Morgan) shows Contributors to Headline Inflation since March 2021. Note: energy and shelter (housing) continue to be the largest contributors. Both can be easily impacted by prevailing market trends and quickly as is evidenced by gasoline prices retreating from recent highs.
Chart 1: Contributors to Headline Inflation
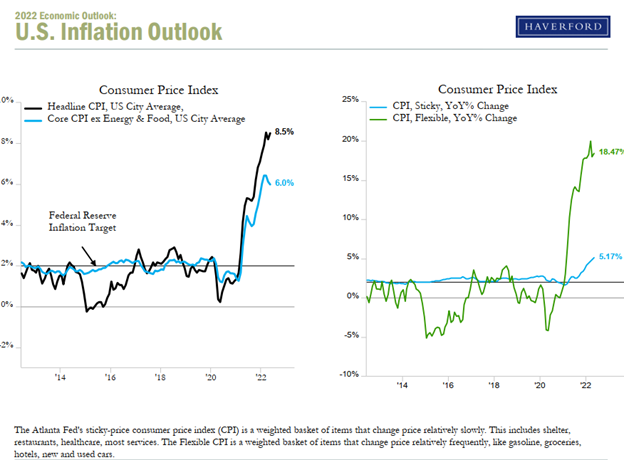
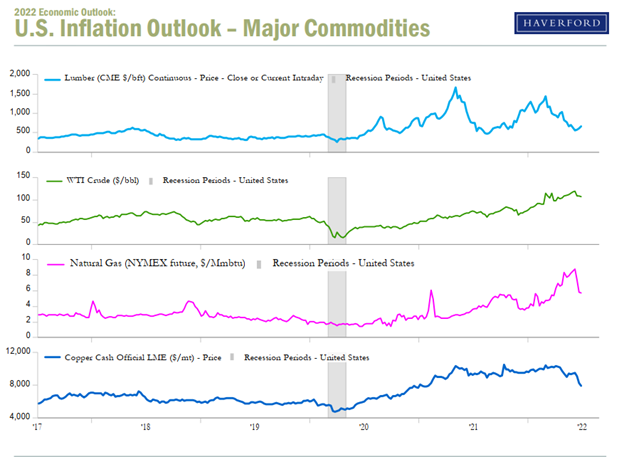
As noted above, we want to do a deeper dive into inflation data hitting the wires. Inflation can be broken down into “sticky” vs “flexible.” See Chart 2 below (from Haverford Trust and the Atlanta Fed) showing CPI broken into Sticky (shelter, healthcare, restaurants) and Flexible (energy, groceries, cars) components. What is important is that the larger share of the current inflation spike is flexible; and therefore, can come down quickly (again evidenced by the recent drop in gasoline prices. Further, see Chart 3 (from Haverford Trust) showing Major Commodity Prices and how they all are down dramatically from their recent highs.
Chart 2: Consumer Price Index (Sticky Inflation vs Flexible Inflation)
Chart 3: Major Commodities Prices
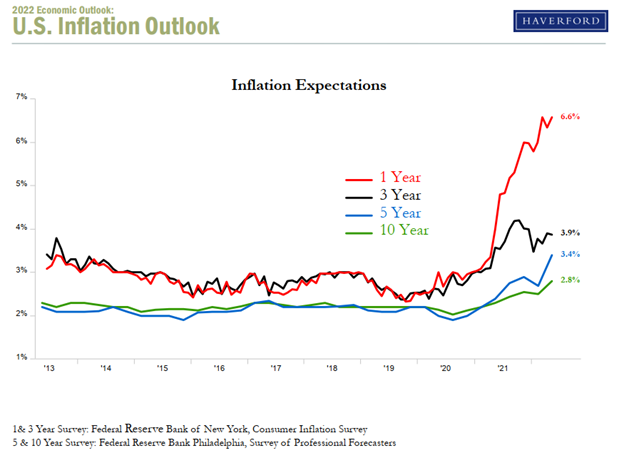
Lastly, as we mentioned last week, expectations for future inflation are drastically different than current inflation trends. Importantly, consumers and the markets are not pricing in continued hot inflation data beyond one year hence. See Chart 4 below (from Philly Fed, NY Fed, & Haverford Trust) showing the 1, 3, 5, and 10-Year Consumer Inflation Expectations. As the markets, consumers and Fed Chairman Jay Powell digest this predictive inflation data, we could see some stabilization in the markets. Watch for earnings releases and employment data as each of these could show where potential weaknesses exist.
Chart 4: 1, 3, 5 and 10-Year Consumer Inflation Expectations
Policy and Politics The Federal Reserve is preparing to raise rates by another 75bps later this month to combat inflation, although a 100bps move is also on the table.
Senator Manchin struck down the Global Minimum Tax proposal, which would require a 15% tax on multinational corporations around the world.
What to Watch
U.S. Retail Gas Price data will be released at 4:30PM ET on July 18th.
U.S. Housing Starts data will be announced at 8:30AM ET on July 19th.
30 Year Mortgage Rate data will be released at 10:00AM ET on July 21st.
THE NUMBERS The Sources: Index Returns: Morningstar Workstation. Past performance is no guarantee of future results. Indices are unmanaged and cannot be invested into directly. Three, five and ten year returns are annualized. Interest Rates: Federal Reserve, Mortgage Bankers Association.
MARKET HEAT MAP The health of the economy is a key driver of long-term returns in the stock market. Below, we assess the key economic conditions that we believe are of particular importance to investors.
US ECONOMY
CONSUMER HEALTH
NEUTRAL
Q1 2022 Real GDP shrunk at a 1.5% annual rate according to the second estimate. The main factors that resulted in a decrease in GDP were a surge in imports and trade deficit highlighting that the U.S. is buying more goods from foreign countries. The July 2022 University of Michigan Consumer Sentiment (Confidence) Index hit 51, a level not seen since 2009 during the GFC, but up slightly from the June Index level of 50, an encouraging sign.
CORPORATE EARNINGS
NEUTRAL
The earnings growth rate for Q1 2022 was 9.2% — the lowest since Q4 2020 (3.8%). This estimate was revised upward from the previous forecast of 7.1% in April. All S&P500 companies have reported earnings — 77% reported a positive EPS surprise and 73% beat revenue expectations. The estimated growth rate for Q2 2022 is now 4.3% which would mark a new post-pandemic low; but still solidly in the “growth” stage.
EMPLOYMENT
POSITIVE
Total nonfarm payroll employment rose by 370,000 in June and the unemployment rate remained constant at 3.6%. Job growth was widespread, led by gains in leisure and hospitality, manufacturing, and transportation and warehousing. Employment in retail trade declined.
INFLATION
NEGATIVE
The annual inflation rate in the US accelerated to 9.1% in June, the highest since November 1981, from 8.6% in May and above forecasts of 8.8%. Core CPI increased by 5.9%, slightly below 6% in May, but above forecasts of 5.7%. The increase in CPI was driven by major surges in food and energy prices, as food costs rose by 10.4% and energy prices by 41.6%.
FISCAL POLICY
NEUTRAL
After passing a $13.6 billion package to support Ukraine a few weeks ago, the House approved an additional $40 billion military and humanitarian package for Ukraine. The bill was passed with 368 votes against 57 votes. The total of the two packages ($53 billion) is the largest foreign aid moved through Congress in over 20 years.
MONETARY POLICY
NEUTRAL
The Fed responded to the persistent inflation numbers by raising rates by 75 basis points, the highest hike since November 1994. The next decisions by the Fed will be data-driven based on future inflation numbers and estimated economic growth, but Fed Funds Futures are currently pricing in a 75 basis point rate hike.
GLOBAL CONSIDERATIONS
GEOPOLITICAL RISKS
NEGATIVE
Russia has defaulted on its debt as of Sunday, June 26th when the 30-day grace period on $100 million of interest payments expired. This is the first Russian default since 1918. Sanctions imposed by Western powers effectively isolated Russia and its financial system from Europe and the U.S. making it much harder for Russia to complete international financial transactions.
ECONOMIC RISKS
NEUTRAL
Supply chain disruptions in the U.S. are waning but the rising cost of oil due to the Russian- Ukraine war is likely to cause additional inflationary pressures not only on gasoline prices but also on many other goods and services. Starting in June, China has started to remove some restrictions in major cities to end the COVID-19 lockdown.
The “Heat Map” is a subjective analysis based upon metrics that VNFA’s investment committee believes are important to financial markets and the economy. The “Heat Map” is designed for informational purposes only and is not intended for use as a basis for investment decisions.