The Markets This Week

by Connor Darrell CFA, Assistant Vice President – Head of Investments
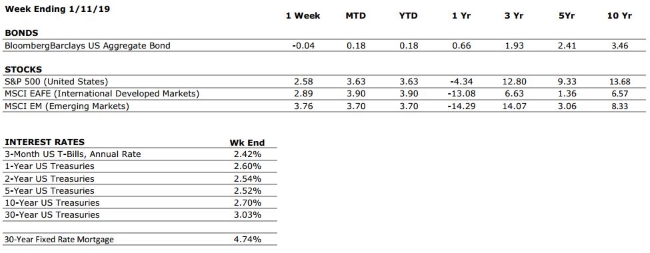
Global equity markets extended their winning streak to four weeks and built on their strong start to 2019, bolstered by reports of further progress in the trade negotiations between the U.S. and China. Markets have climbed higher despite rising uncertainty surrounding the Brexit negotiations and the government shutdown, and there has been a meaningful positive shift in market sentiment over the past few weeks. The market reacted positively to earnings reports from several major S&P 500 constituents even despite results that were otherwise less-than-stellar; a sign that market prices were reflecting overly pessimistic expectations following December’s selloff.

Earnings Season Underway
The quarterly earnings season kicked off last week with approximately 10% of S&P 500 constituents reporting Q4 2018 results. According to FactSet Research, the blended earnings growth rate for those companies that have reported is 10.6%, the fifth straight quarter of double-digit earnings growth.  Analysts have been steadily reducing their estimates for earnings growth throughout the rest of the year, but the expectation is still for growth to remain positive. The earnings growth rate experienced during 2018 was fueled in large part by the year-over-year effects of corporate tax reform, which will no longer have an impact during 2019, so a decline from the mid-20 percent range experienced last year is to be expected.

“Your Financial Choices”

The show airs on WDIY Wednesday evenings, from 6-7 p.m. The show is hosted by Valley National’s Laurie Siebert CPA, CFP®, AEP®.

This week, Laurie will discuss “Financial Planning – What is it and who can help you?” Laurie will take your calls on this or other topics at 610-758-8810 during the live show, or via yourfinancialchoices.com.

Recordings of past shows are available to listen or download at both yourfinancialchoices.com and wdiy.org.

VNFA Hires New Senior Associate

Valley National Financial Advisors welcomes Eric Cedor to the team as Senior Associate.

Eric will work out of Valley National’s Bethlehem office as part of a service team supporting clients in the areas of wealth management and financial planning, as well as continuing professional development through the firm’s Entry Level Professional (ELP) program. The ELP program, now in its seventh year, is specifically designed to prepare the next generation of Financial Advisors at Valley National with key skills and knowledge.
“Our ELP Program continues to be a valuable initiative as we focus on long-term succession for our Financial Advisors,” said Matthew Petrozelli, Chief Executive Officer. “It is important that our clients have a trusted team that supports their personal financial advisor today, and the peace of mind that their service relationship with VNFA will stand the test of time.”

Eric has four years of industry experience. He holds his Series 7, Series 66 and Series 99 securities licenses, and is working to obtain the Pennsylvania Life and Health Insurance license. Eric has a B.B.A in Economics from Temple University’s Fox School of Business.

Eric lives in Bethlehem with his fiancé. In his free time, he is passionate about karate and enjoys teaching others.

Eric can be reached at ecedor@valleynationalgroup.com or at 610-868-9000 x 134

The Numbers & “Heat Map”

THE NUMBERS

Sources: Index Returns: Morningstar Workstation. Past performance is no guarantee of future results. Indices are unmanaged and cannot be invested into directly. Three, five and ten year returns are annualized excluding dividends. Interest Rates: Federal Reserve, Freddie Mac

US ECONOMIC HEAT MAP
The health of the US economy is a key driver of long-term returns in the stock market. Below, we grade 5 key economic conditions that we believe are of particular importance to investors.

CONSUMER SPENDING

A+

Consumer confidence is near all time highs with recent tax reform providing further support. The holiday shopping season was one of the strongest on record.

FED POLICIES

C-

The Federal Reserve implemented its fourth interest rate hike of the year in December. Rising interest rates tend to reduce economic growth potential and can lead to repricing of income producing assets.

BUSINESS PROFITABILITY

B+

Corporate earnings remain strong, but we anticipate earnings growth will taper off in 2019. We are also beginning to see a higher number of companies reducing forward earnings guidance, a sign that earnings growth may have reached its peak in 2018.

EMPLOYMENT

A+

The US economy added 312,000 new jobs in December, blowing estimates out of the water. The unemployment rate rose to 3.9% as a result of new workers entering the labor force. Growth in the size of the labor force is a sign of a healthy labor market.

INFLATION

B

Inflation is often a sign of “tightening” in the economy, and can be a signal that growth is peaking. The inflation rate remains benign at this time, but we see the potential for an increase moving forward. This metric deserves our attention.

OTHER CONCERNS

INTERNATIONAL RISKS

5

The above ratings assume no international crisis. On a scale of 1 to 10 with 10 being the highest level of crisis, we rate these international risks collectively as a 5. These risks deserve our ongoing attention.

The “Heat Map” is a subjective analysis based upon metrics that VNFA’s investment committee believes are important to financial markets and the economy. The “Heat Map” is designed for informational purposes only and is not intended for use as a basis for investment decisions.

The Markets This Week

by Connor Darrell CFA, Assistant Vice President – Head of Investments
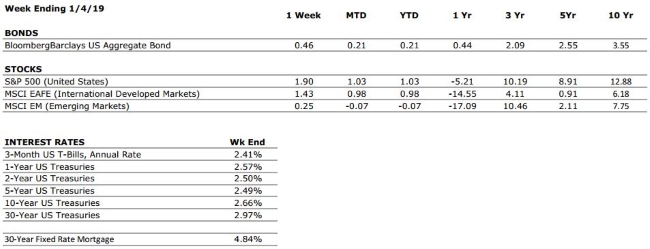
Market’s climbed higher for the third consecutive week as investors shrugged off the lingering uncertainty related to the government shutdown, which has now stretched to the longest in U.S. history. Many economists agree that the shutdown will have an increasing impact on the economy over time, but the impact so far has been negligible (though the hundreds of thousands of federal workers who are no longer receiving paychecks would argue to the contrary). For now, the gridlock in Washington remains more of a distraction than a material concern for financial markets.

Bond yields ticked up slightly as the rotation to fixed income tapered off a bit due to the stabilization in equity markets. Minutes released from the Fed’s December meeting highlighted that recent modest inflation numbers and rising concern over downside risks in financial markets has given policymakers more flexibility to evaluate the current path of monetary tightening, suggesting that a pause in rate hikes may be upon us.

2017 & 2018: Unique in their Own Right
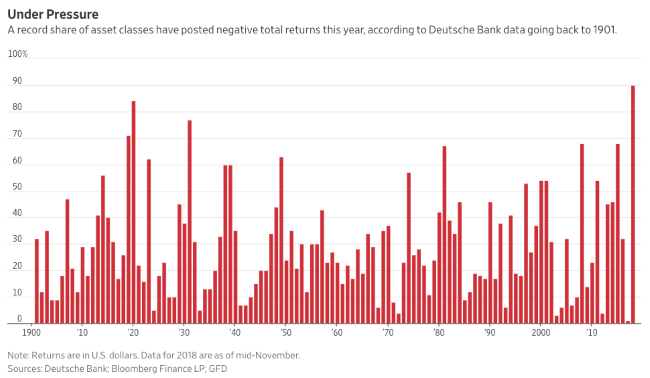
Towards the end of 2018, Deutsche Bank released a very interesting chart (see below) which showed the percentage of asset classes posting negative returns in each year since 1901. It will immediately jump out to readers that 2018 had the highest percentage of asset classes producing negative returns in more than 117 years. But perhaps less obvious in the chart is that 2017 had the lowest percentage. For many investors, the volatility in 2018 felt particularly jarring, and perhaps that is due at least in part to the fact that it represented such an extreme reversal from the 12 months prior. In any case, it is simply astounding that in a 118-year sample of returns history, the two most “extreme” years (as measured by the percentage of asset classes posting negative returns) happened back-to-back. Our takeaway is that the merits of diversification (of which there are many) have been less evident over the past two years because assets have tended to move in the same direction. We view this as somewhat of an anomaly, and caution investors from making significant portfolio adjustments based on experiences during two “outlier” years.

“Your Financial Choices”

The show airs on WDIY Wednesday evenings, from 6-7 p.m. The show is hosted by Valley National’s Laurie Siebert CPA, CFP®, AEP®.

This week, Laurie will discuss “Transitions – life stages, retirement, death.” Laurie will take your calls on this or other topics at 610-758-8810 during the live show, or via yourfinancialchoices.com.

Recordings of past shows are available to listen or download at both yourfinancialchoices.com and wdiy.org.

The Numbers & “Heat Map”

THE NUMBERS

Sources: Index Returns: Morningstar Workstation. Past performance is no guarantee of future results. Indices are unmanaged and cannot be invested into directly. Three, five and ten year returns are annualized excluding dividends. Interest Rates: Federal Reserve, Freddie Mac

US ECONOMIC HEAT MAP
The health of the US economy is a key driver of long-term returns in the stock market. Below, we grade 5 key economic conditions that we believe are of particular importance to investors.

CONSUMER SPENDING

A+

Consumer confidence is near all time highs with recent tax reform providing further support. The holiday shopping season was one of the strongest on record.

FED POLICIES

C-

The Federal Reserve implemented its fourth interest rate hike of the year in December. Rising interest rates tend to reduce economic growth potential and can lead to repricing of income producing assets.

BUSINESS PROFITABILITY

B+

Corporate earnings remain strong, but we anticipate earnings growth will taper off in 2019. We are also beginning to see a higher number of companies reducing forward earnings guidance, a sign that earnings growth may have reached its peak in 2018.

EMPLOYMENT

A+

The US economy added 312,000 new jobs in December, blowing estimates out of the water. The unemployment rate rose to 3.9% as a result of new workers entering the labor force. Growth in the size of the labor force is a sign of a healthy labor market.

INFLATION

B

Inflation is often a sign of “tightening” in the economy, and can be a signal that growth is peaking. The inflation rate remains benign at this time, but we see the potential for an increase moving forward. This metric deserves our attention.

OTHER CONCERNS

INTERNATIONAL RISKS

5

The above ratings assume no international crisis. On a scale of 1 to 10 with 10 being the highest level of crisis, we rate these international risks collectively as a 5. These risks deserve our ongoing attention.

The “Heat Map” is a subjective analysis based upon metrics that VNFA’s investment committee believes are important to financial markets and the economy. The “Heat Map” is designed for informational purposes only and is not intended for use as a basis for investment decisions.