2019 Volunteer Challenge Project
Our team is pleased to announce our 2019 non-profit partner for the Volunteer Challenge. Paxinosa Elementary in Easton is located in the West Ward and is designated as a Trauma Sensitive School. With the help of our Communities in Schools coordinators, Valley National is going to create a much-needed “Just Press Pause” room for teachers to recharge, reset and reduce stress.
Daily Archives: February 12, 2019
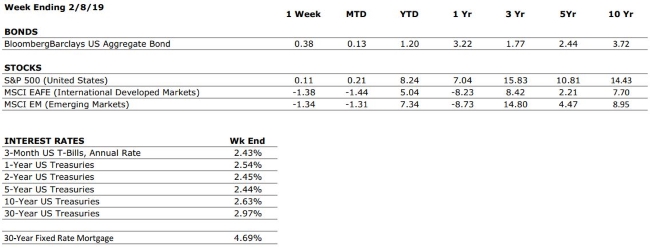
The Numbers & “Heat Map”
Sources: Index Returns: Morningstar Workstation. Past performance is no guarantee of future results. Indices are unmanaged and cannot be invested into directly. Three, five and ten year returns are annualized excluding dividends. Interest Rates: Federal Reserve, Freddie Mac
US ECONOMIC HEAT MAP
The health of the US economy is a key driver of long-term returns in the stock market. Below, we grade 5 key economic conditions that we believe are of particular importance to investors.
|
CONSUMER SPENDING |
A+ |
Consumer confidence was hindered somewhat by the market volatility experienced during December. We are awaiting further data from the US Department of Commerce (which was delayed due to the government shutdown) in order to make an assessment regarding whether this merits a new grade. |
|
FED POLICIES |
C- |
The Federal Reserve implemented its fourth interest rate hike of the year in December. Rising interest rates tend to reduce economic growth potential and can lead to repricing of income producing assets. |
|
BUSINESS PROFITABILITY |
B+ |
Corporate earnings remain strong, but we anticipate earnings growth will taper off in 2019. We are also beginning to see a higher number of companies reducing forward earnings guidance, a sign that earnings growth may have reached its peak in 2018. |
|
EMPLOYMENT |
A+ |
The US economy added 304,000 new jobs in January, soundly beating estimates for the second straight month. The labor market is one of the strongest components of the economic backdrop at this time. |
|
INFLATION |
B |
Inflation is often a sign of “tightening” in the economy, and can be a signal that growth is peaking. The inflation rate remains benign at this time, but we see the potential for an increase moving forward. This metric deserves our attention. |
|
OTHER CONCERNS |
||
|
INTERNATIONAL RISKS |
5 |
The above ratings assume no international crisis. On a scale of 1 to 10 with 10 being the highest level of crisis, we rate these international risks collectively as a 5. These risks deserve our ongoing attention. |
The “Heat Map” is a subjective analysis based upon metrics that VNFA’s investment committee believes are important to financial markets and the economy. The “Heat Map” is designed for informational purposes only and is not intended for use as a basis for investment decisions.
Quote of the Week
“All you need is love. But a little chocolate now and then doesn’t hurt.” – Charles M. Schulz
The Markets This Week
by Connor Darrell CFA, Assistant Vice President – Head of Investments
Global equity markets weakened a bit last week, posting mixed results after news reports suggested that U.S. and Chinese leaders are unlikely to meet before the “trade truce” expires on March 1. Sentiment across markets has remained far more positive than it was at the latter end of 2018, with credit spreads declining to their lowest level since November. Government bonds also fared well as yields continued to decline. The yield on the 10-Year Treasury Note dropped to close the week at 2.63%, down from its high of 3.24% back in November.
How Bond Investing Has Changed Since the Financial Crisis
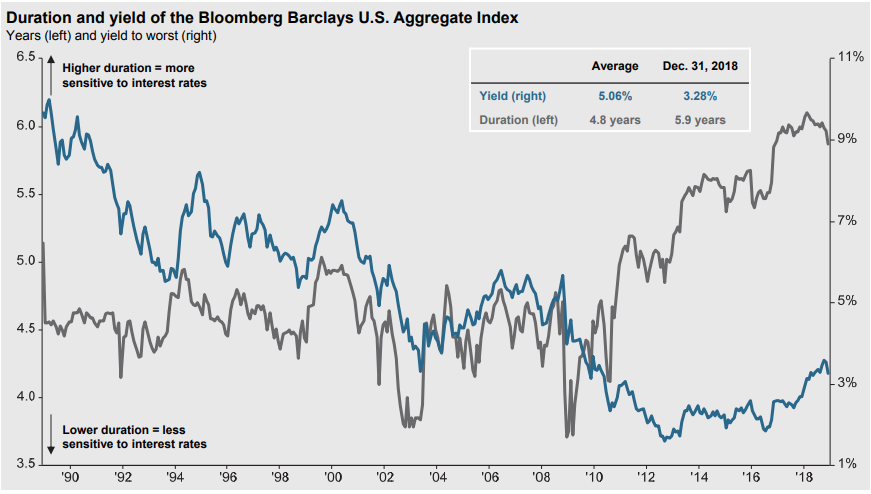
In the world of finance, everything is interconnected, and sometimes it can be incredibly enlightening to take a look at how a change in one area of the economy can have long lasting impacts on global financial markets. The post financial crisis monetary policy environment (marked by artificially low interest rates and high liquidity) has influenced nearly every corner of the economy and the investing world. One major byproduct has been a significant shift in the composition of major bond indices, particularly the Bloomberg Barclays U.S. Aggregate. Over the past 11 years, the yield offered by the average bond in the index has unsurprisingly come down, but the average maturity has also grown longer. Those longer maturities have increased the duration of the index, which is a measure used by bond investors to evaluate how sensitive an investment is to changes in interest rates (see chart provided by JP Morgan Asset Management).
To understand what has transpired, we need to assess the decision making of bond issuers. Low interest rates mean low borrowing costs for corporations, and that provides an incentive for businesses to seek longer term financing (in order to lock in lower rates for a longer period of time). This has changed the mix of securities that make up the index, leading to a higher proportion of longer-term bonds. Passive bond investors should be aware of the changes in the composition of the underlying index being tracked, as the risk/reward outlook for the Bloomberg Barclays Aggregate has become less attractive (lower yields and higher rate sensitivity). In the context of the active vs. passive debate, the proponents of active management may have the strongest argument when it comes to fixed income, where an active manager may be able to manage the tradeoff between yield and duration more effectively.
“Your Financial Choices”
The show airs on WDIY Wednesday evenings, from 6-7 p.m. The show is hosted by Valley National’s Laurie Siebert CPA, CFP®, AEP®.
This week, Laurie will address: “Tax Questions from Listeners.” Laurie will take your calls on this or other topics at 610-758-8810 during the live show, or via yourfinancialchoices.com.
Recordings of past shows are available to listen or download – including last week’s show about the new tax forms – at both yourfinancialchoices.com and wdiy.org.


