
Charles Schwab 1099 forms are scheduled to be available February 16. If we manage your assets with Schwab accounts, we will receive those forms automatically. If you have all of your other source documents, please send everything to us and we will add in the Schwab statements for you – no need to wait for your copies.
Daily Archives: February 15, 2022
Current Market Observations
by William Henderson, Chief Investment Officer
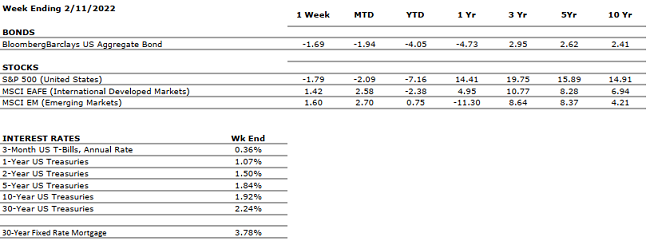
Another hot inflation reading last week sent markets tumbling across all major sectors and all major indexes. Couple that with continued unrest and saber rattling between Russia, Ukraine and NATO Allies and you have the perfect recipe for poor weekly returns. The Dow Jones Industrial Average fell -1.0%, the S&P 500 Index lost -1.8% and the NASDAQ lost -2.2%. Poor weekly returns piled on to weak year-to-date returns and as a result all three major indexes remain well into negative territory for 2022. Year-to-date, the Dow Jones Industrial Average is down -4.3%, the S&P 500 Index is down -7.2% and the NASDAQ is down -11.8%. Fixed income, while weak for most of the year, provided a modicum of safety for risk averse investors. Thus far in 2022, fixed income has fared just as poorly as equities; however, global uncertainty always moves investors to safety. We saw that last week as bonds rallied ever so slightly. The 10-year U.S. Treasury Bond fell one basis point to end the weak at 1.92%.
As mentioned, last Thursday the government reported that inflation rose at a 7.5% annual rate in January, the highest level since 1982. January’s report piled onto the December 2021 level of +7.0%, both of which are well above the Fed’s target inflation level of +2.0% annually. (See the chart below from the Federal Reserve Bank of St. Louis).
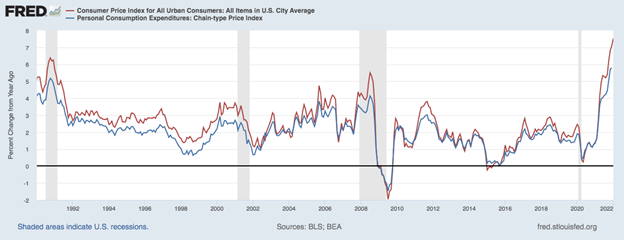
Inflation certainly seems to be out of control and well past the Fed’s target level and many economists now believe the Fed and the FOMC (Federal Open Market Committee) are behind the eight ball with respect to rate hikes. While Fed Chairman Jay Powell has preached patience and a need for moderate rate hikes; futures markets are pricing in a 50-basis point rate hike at the March meeting, according to the CME FedWatch tool. It is important to view the above chart as a whole and look at past recessions, past spikes in inflation and then a resultant calming of inflation as interest rates rose and slowed inflation. While some believe the Fed is behind, it seems to us that the Fed has effectively created their desired inflation and now will deal with it as is their design and plan. The Fed will be monitoring market data and economic indicators between now and the March meeting and that information will determine the magnitude and pace of future rate hikes.
As we have mentioned before, positive returns in equities are possible in years where interest rates are rising. Further, Goldman Sachs published a chart showing varying outcomes for 2022 looking at economic growth and interest rates. Certainly, the economy is slowing from the robust growth we saw immediately after the pandemic-related recession. It is still growing, just at a slowing pace.
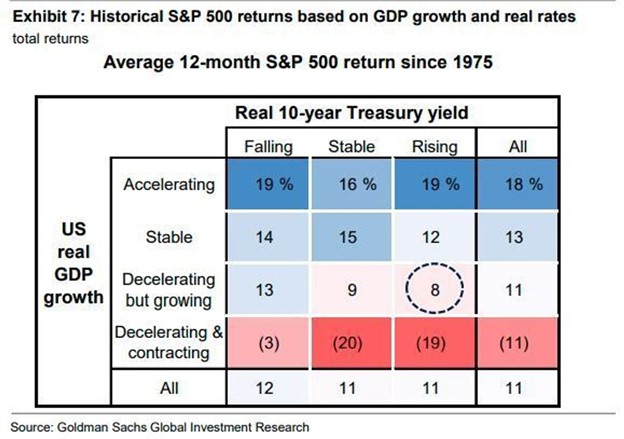
We have certainly seen rising interest rates this year, but as bond yields rise, their attractiveness, especially for pension funds increases as well and buyers eventually return pushing yields lower. One potential outcome for 2022, based on data since 1975, shows modest S&P 500 returns given a growing but decelerating economy and rising yields. (See chart above).
The uncertainty around the Russia / Ukraine situation is real and markets hate uncertainty, as we know. Outcomes here are too risky to predict but it is widely expected that the issue will not result in a global calamity and cooler heads, somewhere, will prevail. On a different note, Bank of America economist, Anna Zhou, reported last week that credit card spending showed a noticeable uptick (+20.2% vs same period in 2020) in the previous two weeks and that the huge increase was due to a surge in services-related spending. This should not be seen as surprising given the recent drop in COVID cases and resultant decreases in mandates by states, including New York, Illinois, and New Jersey. Once the consumer, with a $22 trillion war chest, is free to spend, especially in the travel and leisure sector, we will see continued strong economic growth. Spending coupled with strong employment and inflation absolutely gives the Fed reasons to raise short-term interest rates; and that is what the market has already priced in as we have seen with rises in the two-year (1.57%) and 10-year (1.92%) U.S. Treasury bonds. Watch for a “second reopening” of the economy as the consumer is freed to spend and pandemic fades.
The Numbers & “Heat Map”
THE NUMBERS
 Sources: Index Returns: Morningstar Workstation. Past performance is no guarantee of future results. Indices are unmanaged and cannot be invested into directly. Three, five and ten year returns are annualized. Interest Rates: Federal Reserve, Mortgage Bankers Association.
MARKET HEAT MAP
The health of the economy is a key driver of long-term returns in the stock market. Below, we assess the key economic conditions that we believe are of particular importance to investors.
|
US ECONOMY |
||
|
CONSUMER HEALTH |
POSITIVE |
U.S. Real GDP growth for Q4 2021 increased at an annual rate of 6.9% compared to 2.3% in Q3 (according to advance estimate). The acceleration was driven primarily by private inventory investment. Real GDP increased by 5.7% in 2021 versus a decrease of -3.4% in 2020. Disposable income saw a slight increase of 0.3% and personal saving rate decreased to 7.4% in Q4 from the previous 9.5% in Q3 highlighting increased consumer spending. |
|
CORPORATE EARNINGS |
POSITIVE |
Fourth quarter earnings are showing strong results with 76% of companies that reported earnings so far beating estimates by an average of 8.2%. Some notable positive (Amazon) and negative (Facebook) surprises in big tech. Revenues also well above estimates with 77% of S&P 500 companies reporting actual revenue above forecasts. Blended earnings growth rate for 2021 was 47%. |
|
EMPLOYMENT |
POSITIVE |
U.S. Payroll Report for January U.S. added 467,000 jobs in January, beating estimates of 125,000. Red-hot private sector hiring drives the payrolls surge. Revisions add 709,000 jobs in prior two months. Unemployment rate rises to 4% from 3.9%. |
|
INFLATION |
NEGATIVE |
CPI rose 7.5% year-over-year in January 2022, the highest increase since 1982, driven by the global supply chain backlog and continued consumer pent up demand. Inflation concerns are clearly impacting the markets, the FED and consumer behavior. |
|
FISCAL POLICY |
NEUTRAL |
The Build Back Better Bill has been scaled back from $2.2 trillion to a $1.8 trillion version as Senator Manchin continues to hold back support. President Biden has mentioned the idea of breaking up the BBB Bill into smaller pieces to be able to pass fractions at a time. The economy seems to be digesting a new world where fiscal policy is no longer considered an economic stimulus. |
|
MONETARY POLICY |
NEUTRAL |
Fed discussed a triple threat of tightening: raise interest rates, halt purchases, and reduce its balance sheet (reducing holdings of Treasurys and mortgage-backed securities). Gradual and steady reduction of liquidity will be key in preserving market performance (fast and sudden changes would most likely result in panic-driven sell offs). |
|
GLOBAL CONSIDERATIONS |
||
|
GEOPOLITICAL RISKS |
NEUTRAL |
COVID-19 concerns seem to be abating in many parts of the U.S. with several important states (NJ, NY & IL) finally lifting mask mandates. These moves bode well for spring and summer travel season and resulting consumer spending spree. Important to watch the Russia/Ukraine situation that continues to unfold. |
|
ECONOMIC RISKS |
NEUTRAL |
Supply chain disruptions are hampering the economy; however, demand remains very strong. While global logistics are operating far below normal efficacy, it appears the supply chain is slowly improving with inventories increasing in Q4 2021. Supply chain logistics may reach normalcy by late 2022. |
The “Heat Map” is a subjective analysis based upon metrics that VNFA’s investment committee believes are important to financial markets and the economy. The “Heat Map” is designed for informational purposes only and is not intended for use as a basis for investment decisions.
“Your Financial Choices”
Tune in Wednesday, 6 PM for “Your Financial Choices” with Laurie Siebert on WDIY 88.1FM. Laurie will welcome Thomas M. Riddle, CPA, CFP, Founder & Chairman of Valley National Financial Advisors, to discuss: Running a business – choose your entity type.
Laurie can address questions on the air that are submitted either in advance or during the live show via yourfinancialchoices.com. Recordings of past shows are available to listen or download at both yourfinancialchoices.com and wdiy.org.
Quote of the Week
“The only competition worthy of a wise man is with himself.” – Washington Allston