January has been National Blood Donor Month since 1970. President Richard Nixon proclaimed January 1970 as the first National Blood Donor Month to pay tribute to voluntary blood donors and encourage new donors to join and get more comfortable with donating blood.
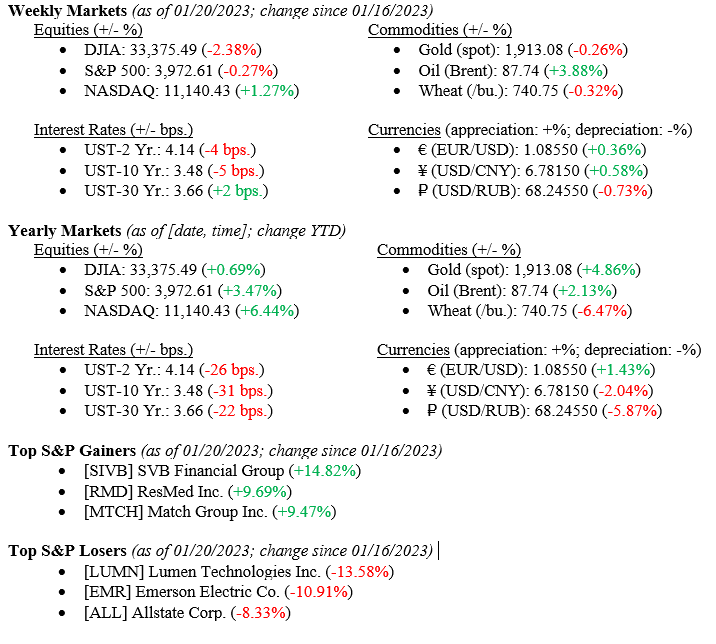
U.S. markets have rallied this year, albeit with some pullbacks over the last week. The Dow Jones saw a 2.38% decline, the S&P down 0.27%, and the NASDAQ ended up 1.27% from a week earlier. Additionally, the Federal Reserve is beginning to consider slowing rate hikes as inflation is showing tentative signs of weakening and recession probabilities are gradually declining. This brings us to the U.S. debt ceiling, which is quickly encroaching. Conversations are set to begin in Congress on tackling this, and the Treasury is imploring that they do so urgently. In all, the markets and economy feel as though they’re leveling out to a certain extent—is this the calm before the storm or signs of sustainable healing?
Global Economy
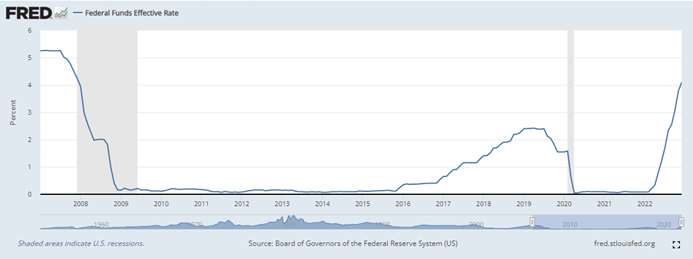
Federal Reserve officials are weighing slowing the pace of interest rate increases yet again from the December hike of 50 basis points, which followed four consecutive months of 75 basis point increases. In recent statements, officials have said that potentially slowing to 25 basis point increases could allow them more time to assess the efficacy of their strategy, as well as determine a reasonable stopping point/pivot. Chart 1 below from the St. Louis Fed’s FRED database shows that the effective federal funds rate is still roughly 100 basis points below rates going into the Global Financial Crisis of 2008/2009. For reference, Goldman Sachs Research is anticipating three more 25 basis point hikes before capping out at the 5.00-5.25% level and holding through year-end.
Chart 1: Effective Federal Funds Rate (01-01-2007 through 12-01-2023)
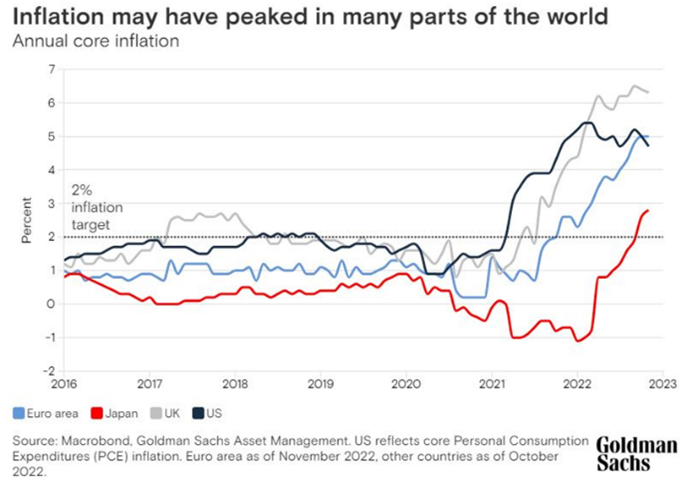
For the past year, the topics of recessions and inflation have been at the forefront of nearly every conversation surrounding the global economy. In a recent survey conducted by Goldman Sachs Research, which interviewed 400 respondents, 57% expect a recession in 2023. Goldman’s economists, on the other hand, do not expect a recession, citing a 35% chance for 2023. Additionally, there are tentative signs that the sticky inflation from 2022 could be decreasing, though that does not necessarily mean that it will fall evenly across those categories. For example, tight labor markets may be unable to slow increasing wages, and commodity supply shocks are possible. Chart 2 below shows annual core inflation from 2016 through 2023 across several geographical regions.
Chart 2: Annual Core Inflation across geographical regions (2016 through 2023)
Policy and Politics
This week, Congress is returning from its short recess and is expected to focus on the typical partisan issues. A Democratic senate will focus on Pres. Biden’s judicial nominees and a Republican house on investigations into the administration on various topics. However, the most pressing issue on Congress’s plate is the ever-approaching debt ceiling, and a path forward for the U.S. President Biden has reiterated that he will not negotiate on debt limits as “[raising the ceiling is the] obligation of this country and its leaders to avoid economic chaos.” House Speaker McCarthy is willing to use the debt ceiling conversation as leverage toward spending cuts, stating, “[we’ll] discuss a responsible debt ceiling increase to address irresponsible government spending.” Regardless of negotiations and concessions, the debt ceiling conversation needs to be sorted out sooner rather than later, as the Treasury would be unable to prevent default if the limit is breached. According to Janet Yellen, the Treasury’s systems are not designed to give priority to bondholders after borrowing limits are exceeded.
What to Watch
Monday, January 23rd, 2023
4:30PM: U.S. Retail Gas Price (Prior: $3.366/gal.)
Thursday, January 26th, 2023
8:30AM: U.S. Real GDP Quarter over Quarter (Prior: 3.20%)
10:00AM: 30 Year Mortgage Rate (Prior: 6.15%)
Friday, January 27th, 2023
8:30AM: U.S. Core PCE Price Index Year over Year (Prior: 4.68%)
10:00AM: U.S. Index of Consumer Sentiment (Prior: 64.60)
10:00AM: U.S. Pending Home Sales Year over Year (Prior: -37.79%)
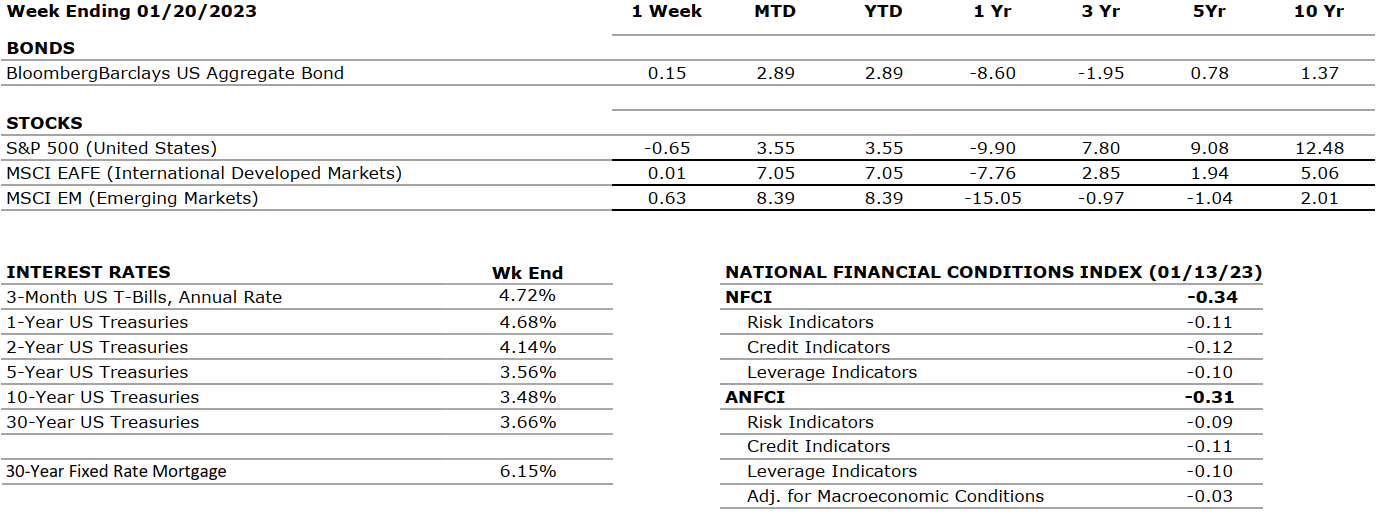
The Sources: Index Returns: Morningstar Workstation. Past performance is no guarantee of future results. Indices are unmanaged and cannot be invested into directly. Three, five and ten year returns are annualized. Interest Rates: Federal Reserve, Mortgage Bankers Association.
MARKET HEAT MAP The health of the economy is a key driver of long-term returns in the stock market. Below, we assess the key economic conditions that we believe are of particular importance to investors.
US ECONOMY
CONSUMER HEALTH
NEUTRAL
Real gross domestic product (GDP) increased at an annual rate of 3.2 percent in the third quarter of 2022, in contrast to a decrease of 0.6 percent in the second quarter. The third quarter’s increase primarily reflected exports and consumer spending that were partly offset by a decrease in housing investment. The estimated growth rate for Q4 2022 Real GDP is now 3.8%.
CORPORATE EARNINGS
NEUTRAL
The earnings growth rate for Q3 2022 was 2.4%. For Q4 2022, earnings are expected to decline by -4.6%, down from the previous estimate of -3.9%. This would be the first negative growth since Q3 2020 (-5.7%). So far, 11% of S&P 500 companies have reported actual results — 67% of companies beat EPS estimates, and 64% beat revenue expectations.
EMPLOYMENT
NEUTRAL
U.S. Nonfarm Payrolls for December 2022 increased by 223,000, and the unemployment rate fell slightly to 3.5% from 3.7%. Leisure and hospitality, health care, construction, and social assistance were among the sectors with the most notable gains.
INFLATION
NEGATIVE
The annual inflation rate in the U.S. increased by 6.5% for December 2022 compared to the November reading of 7.1%. This is the lowest CPI value since October 2021. Core CPI rose at a rate of 5.7% versus 6.0% in November. Most prices fell during the last month of the year, including food, used cars, and most energy sources. Electricity and shelter still saw an increase from the previous month.
FISCAL POLICY
NEUTRAL
Senator Manchin and Majority Leader Schumer agreed on the latest tax and energy bill with incentives for green energy, electric cars, and oil & gas companies for exploration. No changes in private equity taxes or higher tax rates for the very wealthy were enacted. The Senate has officially passed the bill. President Biden announced student loan forgiveness of up to $20,000, subject to income limitations.
MONETARY POLICY
NEGATIVE
Last month the Fed approved a 50-bps rate hike after four consecutive 75-bps hikes taking its target range to 4.25%-4.50%. Although the magnitude of rate hikes has been decreased, rates are likely to be kept higher through 2023 with no reductions until 2024. According to the FOMC’s dot plot, the expected terminal rate is now 5.1%. The next meetings will be held at the end of January and the beginning of February.
GLOBAL CONSIDERATIONS
GEOPOLITICAL RISKS
NEGATIVE
While the Russian-Ukraine conflict does not show signs of abating, additional geopolitical issues have arisen in South America with the violent protests that hit the capital of Brazil last week. Following the October 2022 elections won by the left party, Jair Bolsonaro’s far-right supporters stormed Brasilia accusing the winning candidate and party of corruption. Bolsonaro is currently in Florida and has communicated little publicly.
ECONOMIC RISKS
NEGATIVE
China seems to have abandoned its zero-Covid policy, which should help the global supply chain recover. Gas supplies from Russia to Europe have decreased by 88% over the past year, and EU countries have agreed to cut gas usage by 15% as gas prices have more than doubled. Nevertheless, an unusually mild winter has helped most of Europe deal with increased energy costs.
The “Heat Map” is a subjective analysis based upon metrics that VNFA’s investment committee believes are important to financial markets and the economy. The “Heat Map” is designed for informational purposes only and is not intended for use as a basis for investment decisions.