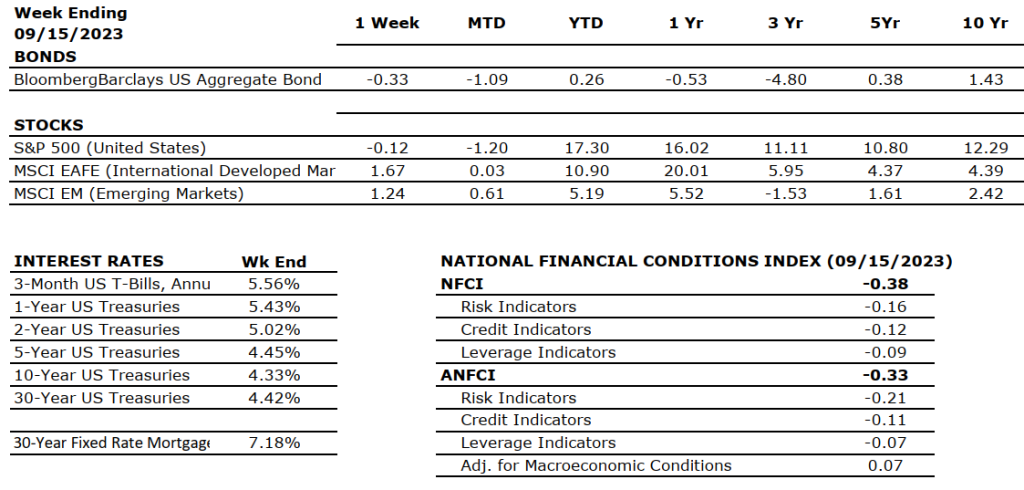
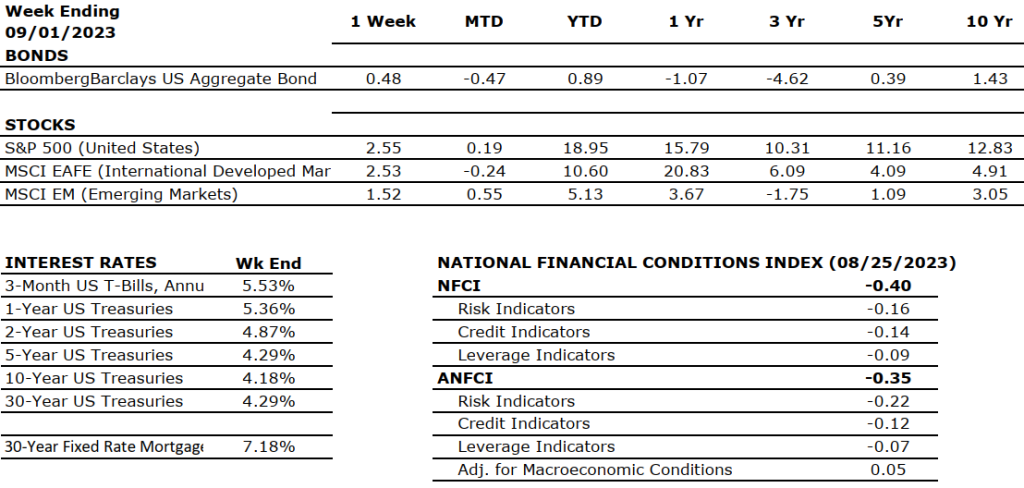
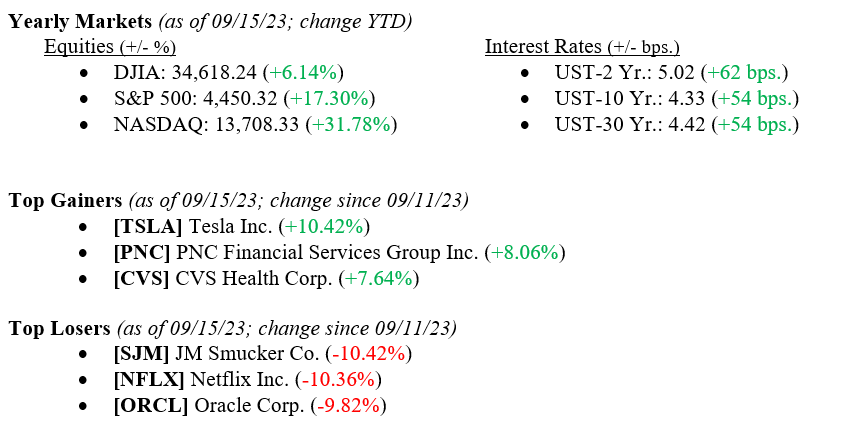
U.S. stocks ended the week essentially flat. The Dow Jones Industrial Average gained 0.12% on the week, the S&P 500 lost 0.16%, and the NASDAQ fell 0.39%. Last week, U.S. inflation grew to 3.67% from 3.18% the month prior. Additionally, mortgage rates climbed to an average of 7.18% from 7.12%, the highest rate since May 2001. It’s also worth noting that the Index of Consumer Sentiment, a survey of general economic outlook based on a random sample of U.S. households, has fallen to 67.70, a slight drop from the prior month but still significantly ahead from a year ago when it was 58.60 (the higher consumer sentiment, the better). These reports coincide with a slight sell-off in bonds, with the 10-year U.S. Treasury ending the week at 4.33%, seven basis points higher than last Friday. As always, please reach out to your advisor at Valley National Financial Advisors with any questions or concerns.
Global Economy
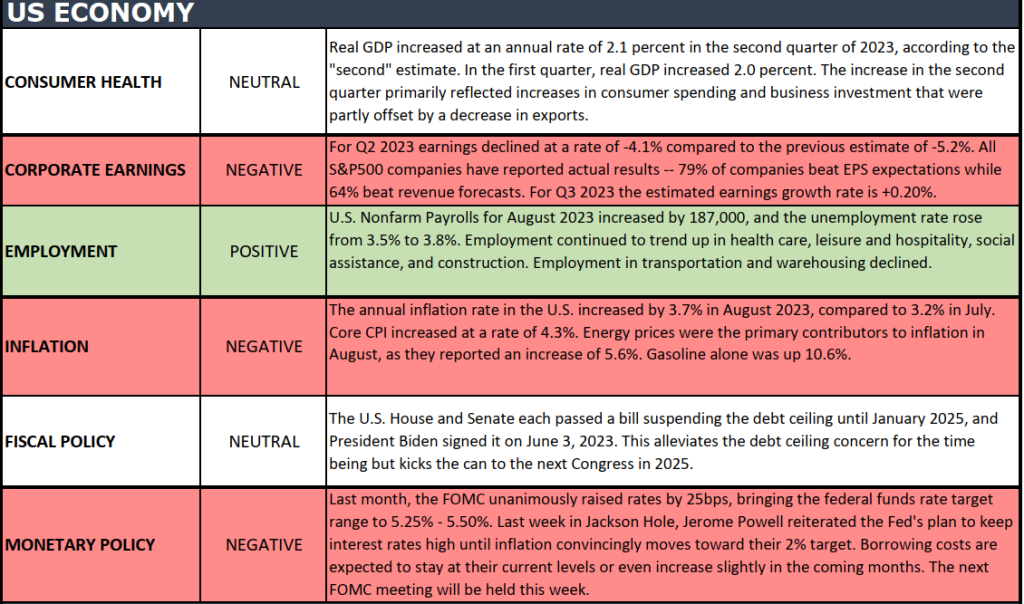
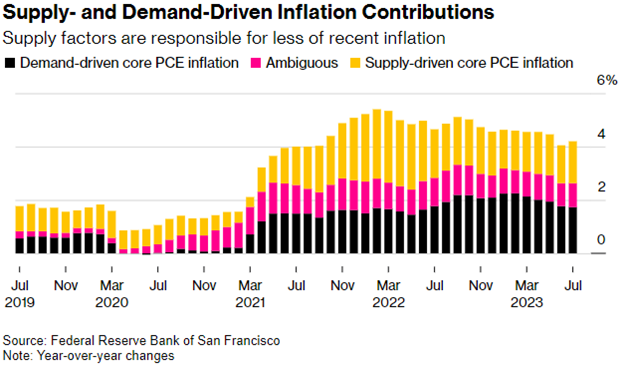
Though the Federal Reserve has raised rates by more than 500 basis points since January 2022, there has been a limited slowdown in US consumer demand. With the most recent inflation number gaining month-over-month, policymakers are beginning to look at rates from a new perspective: what do rate hikes mean for the supply side of the economy? The argument is that if rates rise too high, they could potentially undermine the benefits of increasing supply, as discussed in a paper presented at Jackson Hole last month. Despite this, we expect the Fed to remain data-driven in its battle to bring inflation down to the 2% target—it is unlikely that they will act solely on this argument moving forward when their action plan has proven relatively effective. Chart 1 below shows the components of inflation that are driven by either demand or supply.
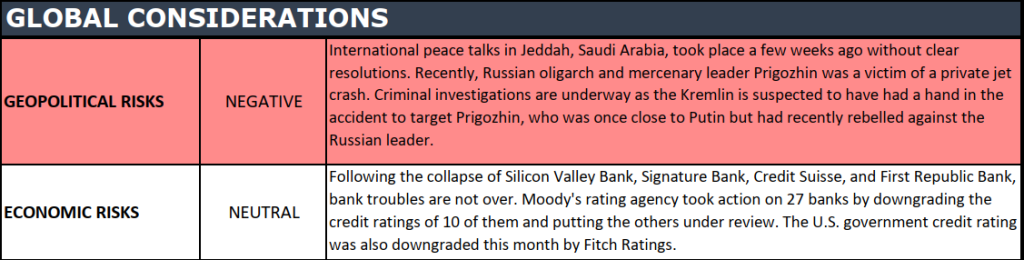
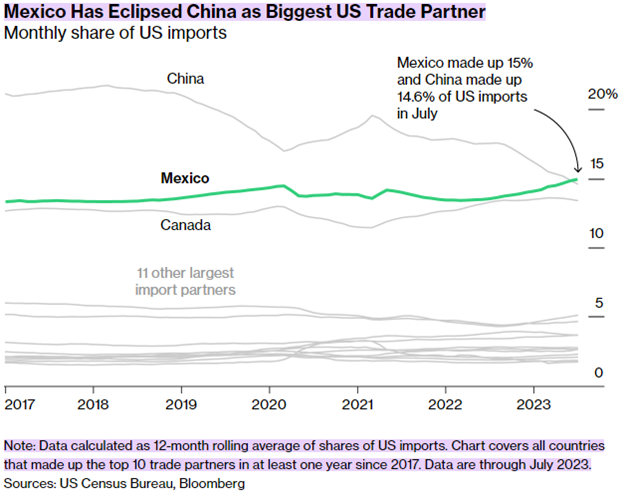
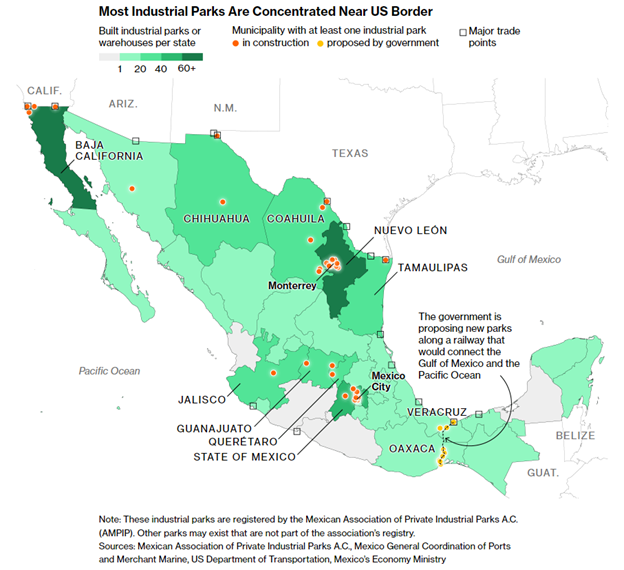
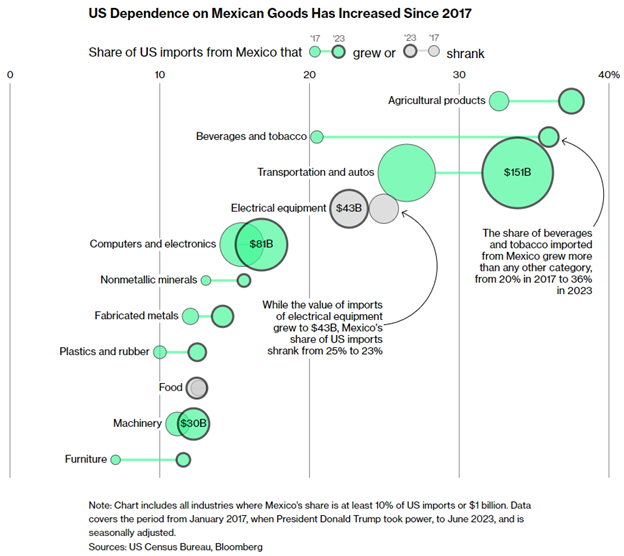
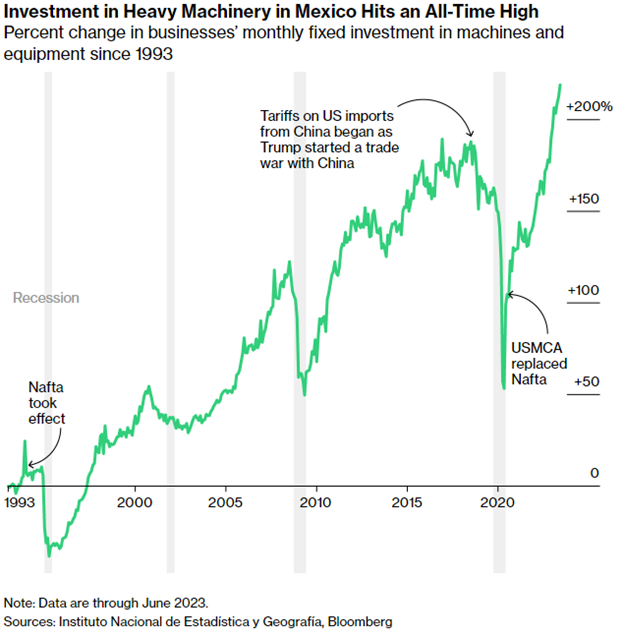
As of July, Mexico has overtaken China as the United States’s largest trade partner, representing 15% of U.S. imports (versus China’s 14.6%). Chart 2 below shows the trend in U.S. imports since 2017. As U.S.-China relations soured, the share of imports from Mexico and Canada increased significantly over the last six years, making nearshoring to Mexico a much more attractive option. Chart 3 is a map of major industrial parks that produce goods that eventually make their way into the United States—it’s no surprise that most of them are located near the border. As investment into these industrial parks increased, so did the U.S.’s dependence on Mexican goods. Since 2017, all categories of imports have increased except for food and electrical equipment, which decreased. Chart 4 shows each import category and their respective sizes. Chart 5 shows the change in investment in heavy machinery in Mexico since 1993—notice the sharp decline from when tariffs on Chinese goods began in 2018 through 2020 and then the sharp rise once the USMCA was enacted in place of NAFTA.
What to Watch
- Monday, Sept. 18th
- 4:30PM – Retail Gas Price (Prior: $3.941/gal.)
- Tuesday, Sept. 19th
- 8:30AM – Housing Starts (Prior: 3.86%)
- 10:00AM – Job Openings: Total Nonfarm (Prior: 8.827M)
- Wednesday, Sept. 20th
- 2:30PM – Target Federal Funds Rate (Prior: 5.25-5.50)
- Thursday, Sept. 21st
- 8:30AM – Initial Claims for Unemployment (Prior: 220k)
- 10:00AM – Existing Home Sales (Prior: 4.07M)
- 12:00PM – 30 Year Mortgage Rate (Prior: 7.18%)