
Happy Halloween from your VNFA Family.

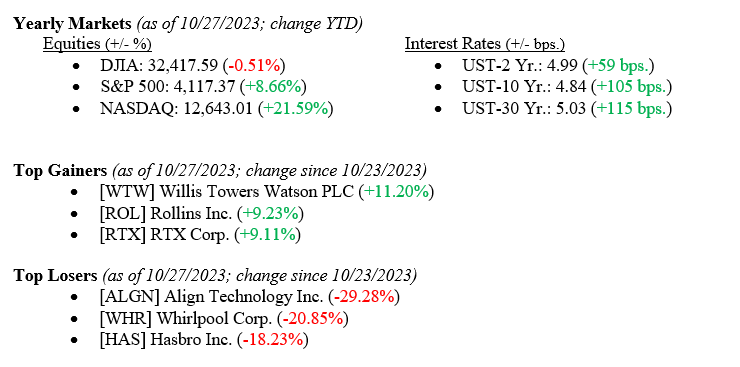
U.S. Equity markets were battered again last week across all sectors, even in the face of strong economic data released that showed 3rd quarter GDP rose +4.90%. Weak and mixed earnings reports and continued global turmoil weighed more heavily on the markets than a strong GDP report. For the week, the Dow Jones Industrial Average fell -2.1%, the S&P 500 Index dropped -2.5% and the NASDAQ fell -2.62%. Meanwhile, the 10-year U.S. Treasury bond yield fell nine basis points to close the week at 4.84% as several large investment houses either lifted their short trade on treasuries or recommended an outright buy for the sector. Both moves rallied bond prices.
US Economy
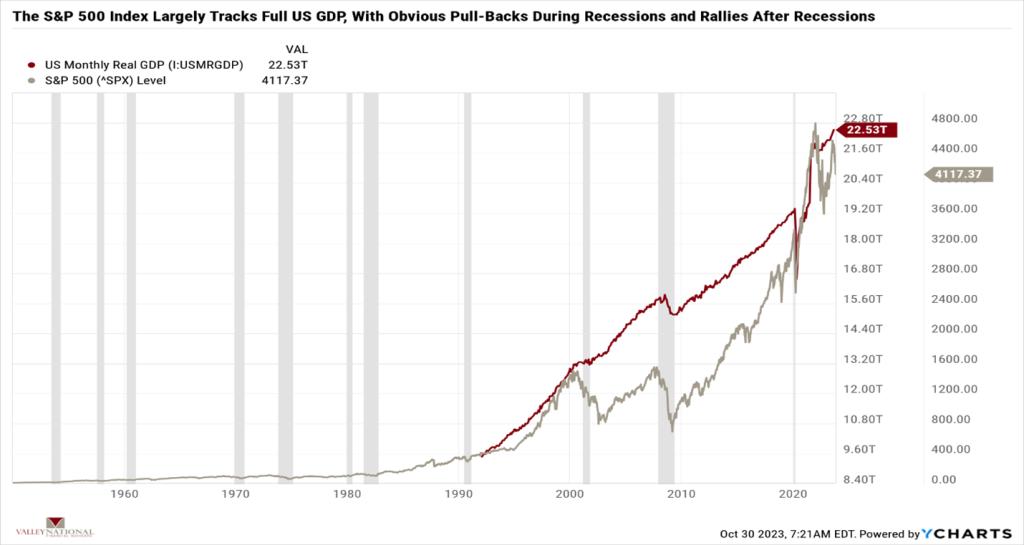
As mentioned above, the 3rd quarter U.S. GDP was released last week and showed that the U.S. economy grew by 4.90%, which was more than double the 2nd quarter rate and led by consumer spending on Travel & Leisure and Retail Goods & Services. The economy has been bolstered by a strong labor market and consumer savings accumulated during the pandemic. See Chart 1 below from Valley National Financial Advisors and Y Charts below showing the U.S. GDP and S&P 500 Index since 1950. We purposely picked an exceptionally long-dated chart to show why it is important to think about investing over extended periods rather than over very volatile short periods of time. You will see from the chart that, over time, the S&P 500 Index grows with the U.S. economy, and we continue to believe that the U.S. economy has a long way to go from here, especially over an extended period. Remember, time is an investor’s partner, not their enemy, and it is easy to get caught up in the volatile short-term noise and miss the big picture.
This week, we will look at the latest FOMC report after their two-day meeting ends on November first. Futures markets and traders are currently pricing in another “pause” in interest rate movements, which would be welcomed, but alone not enough to move markets higher. However, if that announcement is paired with a more dovish statement or language akin to “we believe the current interest rate levels are sufficient to combat inflation,” we could see the fear leave the markets to be replaced by positive investor sentiment.
Policy and Politics
Last week, we emphasized our concerns impacting markets: global regional turmoil, fear of the Fed continuing to raise interest rates and uncertainty related to our political spectrum. With the election of Congressman Mike Johnson (R-LA) as U.S. Speaker of the House, the political sideshow and uncertainly related to it has been lifted, and Washington (rightly or wrongly) can now get back to work with focus on a spending bill that avoids another embarrassing government shutdown.
What to Watch
Certainly, the economy continues to grow at a healthy pace despite interest rates rising from 0.00% to 5.50%. However, we are seeing sanguine earnings releases from companies and, along with that, language from CEOs and CFOs pointing to less-than-stellar earnings going forward. We stated before that interest rate hikes take time to work through the economy (typically 9-18 months). The first-rate hike in this cycle was in March 2022, about 18 months ago. We believe the FOMC is close to being finished with rate hikes as inflation continues to creep towards their 2% target (the September 2023 rate was 3.7%). As usual, watch for dovish (lower rates) or pivot (hike to cuts) language from Fed Chairman Jay Powell during the press conference after the FOMC meeting and announcement this Wednesday. We understand there is a lot of conflicting data: a growing economy, healthy consumer spending, strong labor market, less than stellar earnings, high-interest rates hurting the real estate market, and, of course, all equity markets continuing to sell off each week. Sometimes, it is not easy to be an investor. Please reach out to your financial advisor at Valley National Financial Advisors for questions or help.
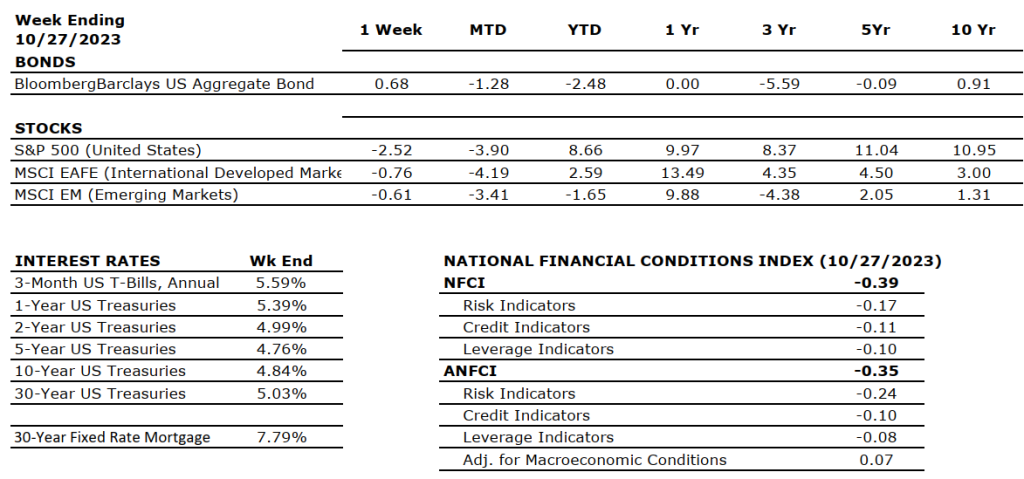
Sources: Index Returns: Morningstar Workstation. Past performance is no guarantee of future results. Indices are unmanaged and cannot be invested into directly. Three, five- and 10- year returns are annualized excluding dividends. Interest Rates: Federal Reserve, Mortgage Bankers Association.
MARKET HEAT MAP
The health of the U.S. economy is a key driver of long-term returns in the stock market. Below, we grade key economic conditions that we believe are of particular importance to investors.
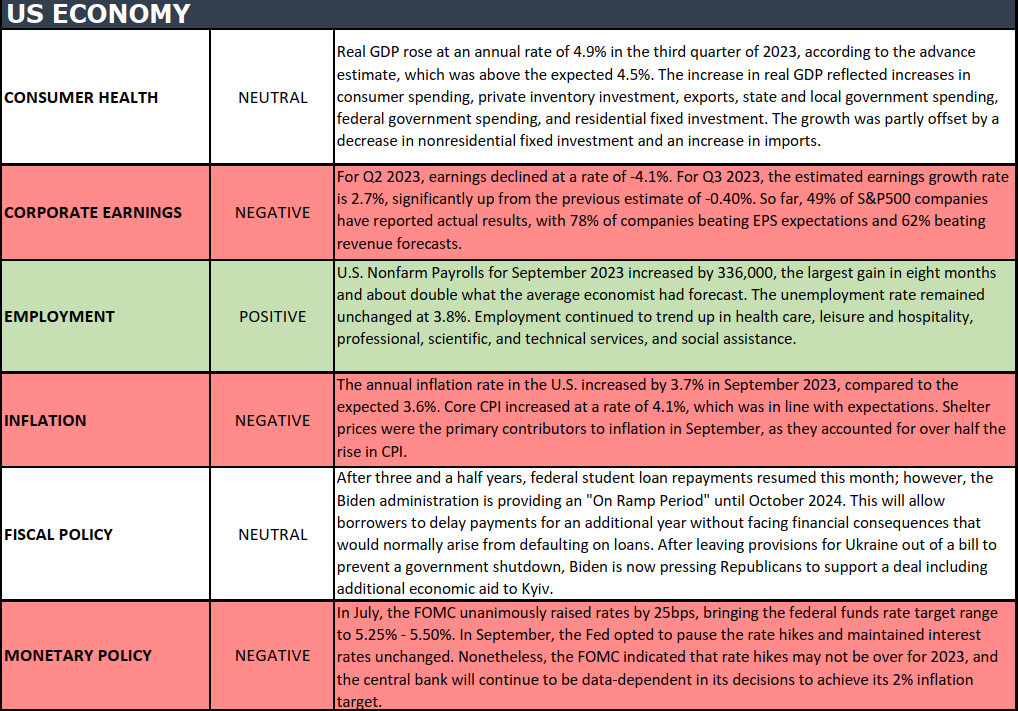
The “Heat Map” is a subjective analysis based upon metrics that VNFA’s investment committee believes are important to financial markets and the economy. The “Heat Map” is designed for informational purposes only and is not intended for use as a basis for investment decisions.
“People begin to become successful the minute they decide to be.” – Harvey MacKay
Join Laurie on Wednesday at 6PM on wdiy.org 88.1FM for Your Financial Choices- Make Financial Planning Work for You.
Questions can be submitted at yourfinancialchoices.com in advance of the live show. Recordings of past shows are available to listen or download at both yourfinancialchoices.com and wdiy.org.
There is still time to support WDIY 88.1 FM and Second Harvest Food Bank of Lehigh Valley and Northeast Pennsylvania. Valley National Financial Advisors will continue their support to provide meals through Second Harvest Food Bank.

Donate by calling WDIY at 610-758-8810 or completing the Donation Form online. Visit WDIY to learn more and get involved.
Financial Planning Month is indeed an excellent opportunity to emphasize the importance of financial planning and empower individuals and families to secure their financial futures. Here are some valuable financial planning tips from expert Laurie A. Siebert, CPA, CFP®, AEP®.

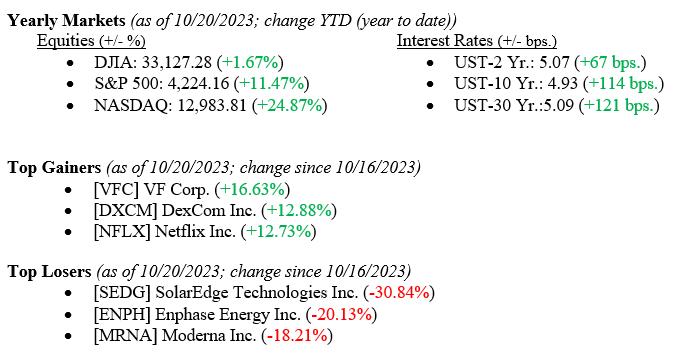
All three major market indexes posted heavy losses for the week, with the Dow Jones Industrial Average falling –1.6%, the broader S&P 500 Index falling –2.4%, and the tech-heavy NASDAQ falling –3.2%. A flurry of uninspiring earnings releases, higher bond yields, and continued global unrest led to the losses. Bond yields meanwhile moved higher, with the yield on the 10-year U.S. Treasury rising 15 basis points to close the week at 4.93%. Early reports this week show a 10-year Treasury yield moving to 5.00%, a level not seen since 2007. Two weeks ago, in this report, we introduced three words in our commentary that we do not take lightly. The words were turmoil, fear, and uncertainty. In this week’s report, we unpack those words and explain why we remain concerned.
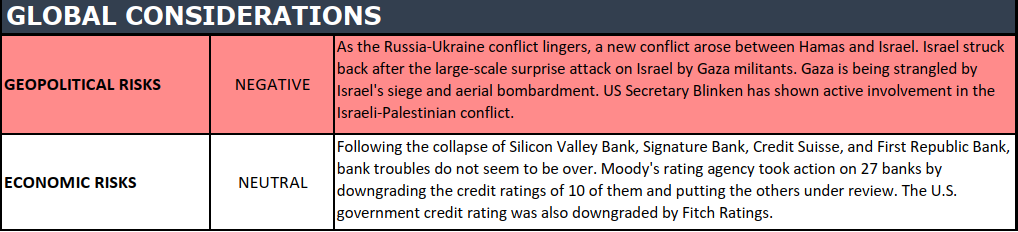
Global Economy
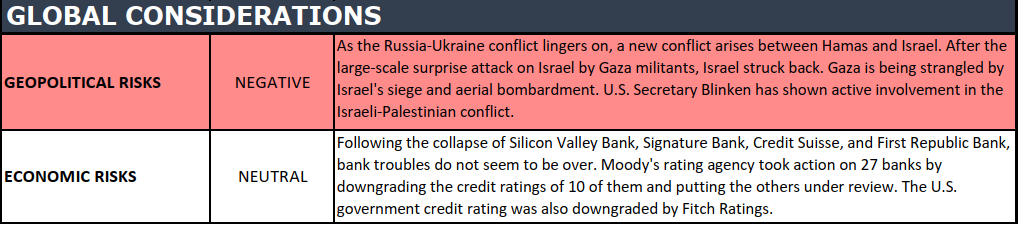
The global economy is where turmoil firmly falls on the markets. The Israel/Hamas war continues without any view to a swift or less costly end to the conflict. The Middle East has rarely been a calm place, but relations have certainly been better than they are now among members of the region. For obvious reasons, oil markets and global trade rely on relative calm in the region – major oil producers are located here, and trade through the Suez Canal is a critical route for Asia/Europe trade. The Israel/Hamas War piles onto the Russia/Ukraine War and the China/Taiwan concerns. Hence, our use of the word turmoil – “a state of great disturbance or confusion.”
Policy and Politics
The second word we introduced is fear. Why fear? For the first time in many years, investors are fearing the Fed instead of welcoming the Fed and their concomitant market actions. Last week, in a speech to the Economic Club of NY, where we have two Valley National Group investment associates present, Fed Chairman Powell danced around the future path or direction of interest rates, pointing instead to the data as his compass for what the Fed will do next. Investors hoped to hear language stating that future rate hikes were off the table, but that was not the case in both fixed-income and equity markets sold off because everyone was still waiting for the classic Fed Put. The Fed Put happens when markets expect and price in lower interest rates, not higher ones. So, instead of welcoming Fed actions, markets fear future Fed actions. We believe that the economy remains healthy, which is most evident in the consumer who continues to spend. The labor market, where unemployment remains at a near-record low level of 3.8% and housing, while slower, continues to exhibit resilience.
What to Watch
We chose the summary for the week to discuss our third word – uncertainty. We have discussed markets hating uncertainty the most out of all worrisome trends. Typically, in a market where fear and turmoil exist, investors are uncertain, and their natural reaction is a flight to quality, which means buying U.S. Treasuries. However, U.S. Treasuries continue to sell off as the Federal Reserve’s surge in debt supply and mixed signals on the rate path weaken fixed-income markets. Furthermore, our leaders in Washington continue to do nothing as they wrangle to simply fill the U.S. Speaker of the House position, notably the third position in line for succession to the U.S. President.
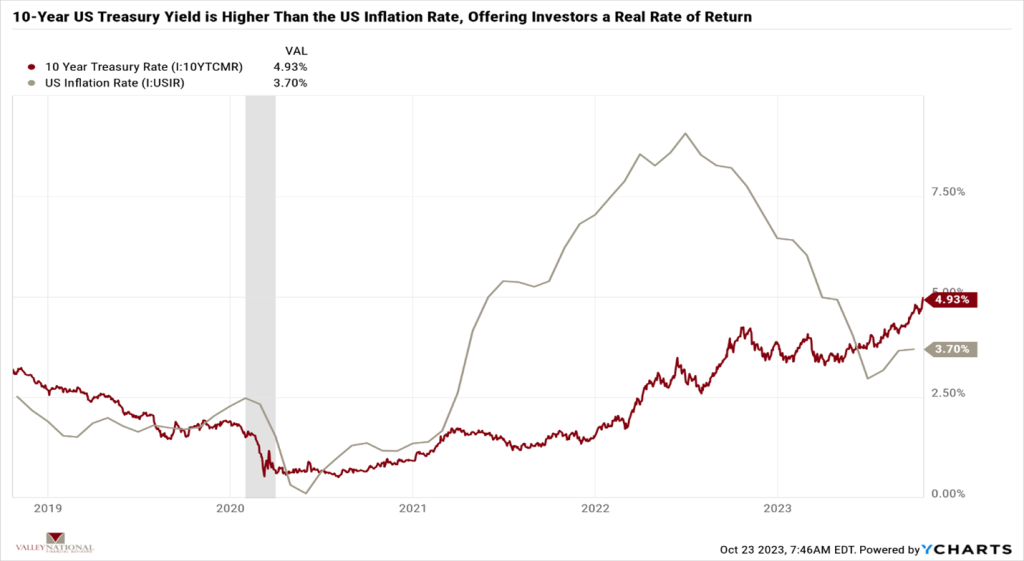
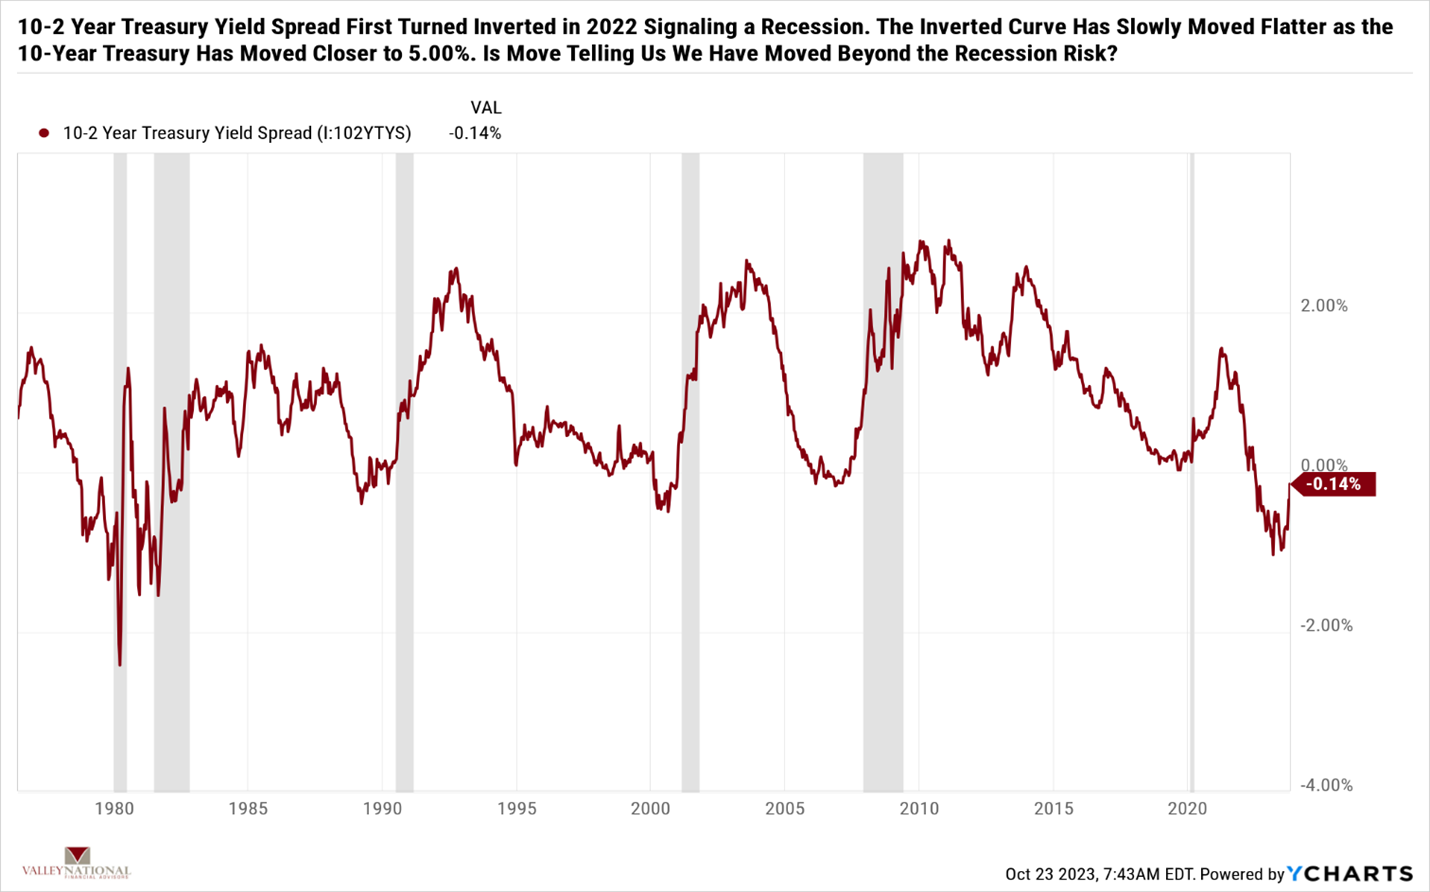
Uncertainty persists in our leaders, world politics, and the markets, so while it is not unusual for markets to sell off, it is unusual to see such a connected and broad sell-off in all markets in tandem. Treasuries at 5.00% offer investors real after inflation yields. See charts 1 & 2 above by Valley National & Y Charts showing first the U.S. Inflation rate and the 10-year U.S. Treasury yield and second the 10-2-year Treasury Yield Spread.
We expect to see turmoil, fear, and uncertainty in the market until each issue gets resolved over time, and time is always on the patient investors’ side. The patient investor can outlast uncertainty. Reach out to your advisor at Valley National Financial Advisors for advice or questions.
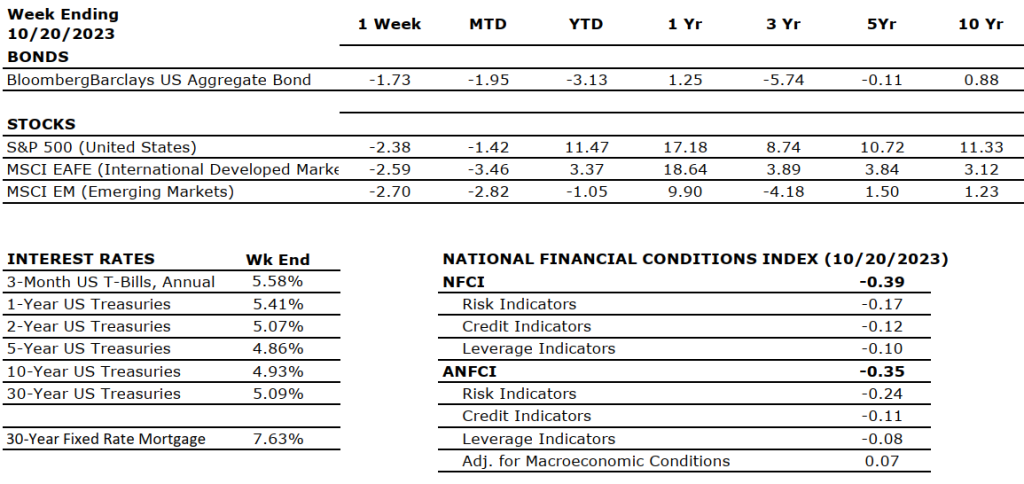
Sources: Index Returns: Morningstar Workstation. Past performance is no guarantee of future results. Indices are unmanaged and cannot be invested into directly. Three, five- and 10- year returns are annualized excluding dividends. Interest Rates: Federal Reserve, Mortgage Bankers Association.
MARKET HEAT MAP
The health of the U.S. economy is a key driver of long-term returns in the stock market. Below, we grade key economic conditions that we believe are of particular importance to investors.
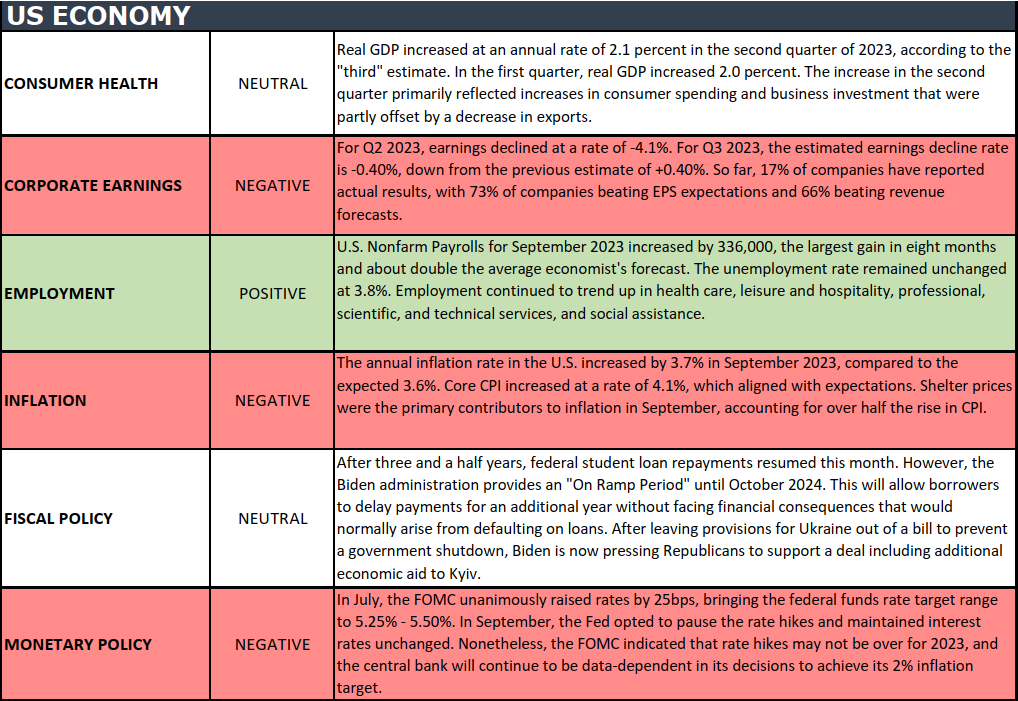
The “Heat Map” is a subjective analysis based upon metrics that VNFA’s investment committee believes are important to financial markets and the economy. The “Heat Map” is designed for informational purposes only and is not intended for use as a basis for investment decisions.
“Often when you think you’re at the end of something, you’re at the beginning of something else.” –Fred Rogers