It is a fantastic day to come together and encourage generosity. According to GivingTuesday.org, it is a day that encourages people to do good, an idea that, over the years, has grown into more than just one day. There are so many different ways to show generosity on GivingTuesday. Learn more about GivingTuesday; visit GivingTuesday for more information.
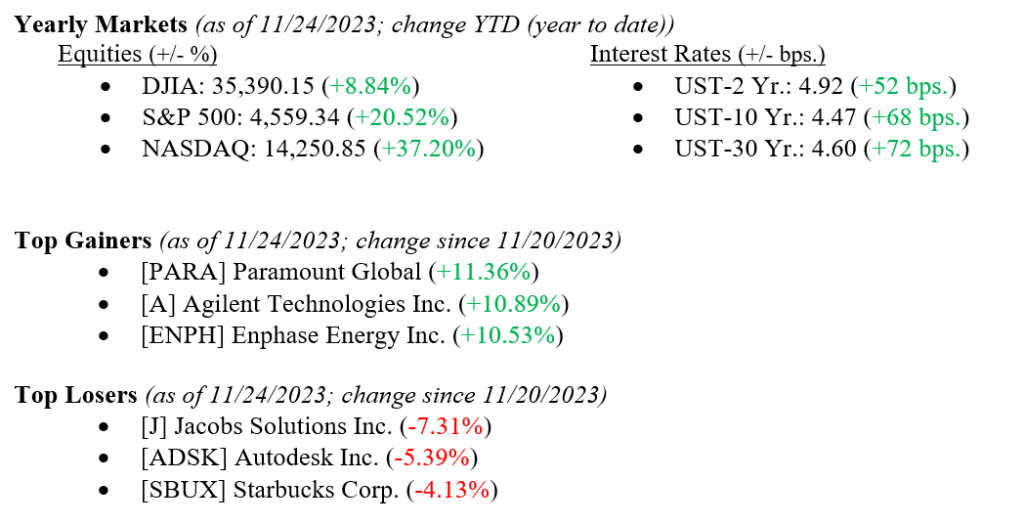
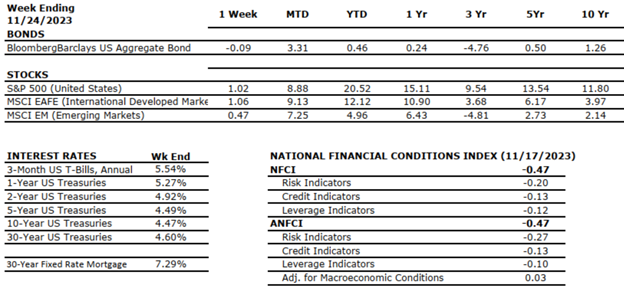
Last week continued the month-long rally we have witnessed across all markets and sectors, with the Dow Jones Industrial Average adding +1.3%, the S&P 500 Index adding +1.1%, and the NASDAQ adding +1.0%. Year-to-date returns also remain healthy across all market indexes (see figures below). Small-capitalization stocks, which have been absent all year, added another +1.9% last week, bringing the year-to-date returns to +4.1%. We point this out as a needed broadening in the 2023 stock market rally to sectors beyond the “Magnificent 7” mega-cap tech stocks into small-cap and industrial names. The month-long stock market rally has been predicated on three issues: softening inflation data, positive earnings releases from U.S. corporations, and a widespread belief that the Federal Reserve is done raising interest rates. The 10-year U.S. Treasury bond closed the week at 4.47%, three basis points higher than last week’s close.
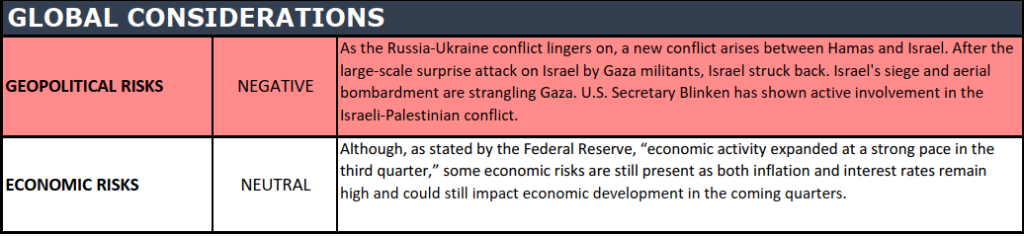
Global Economy
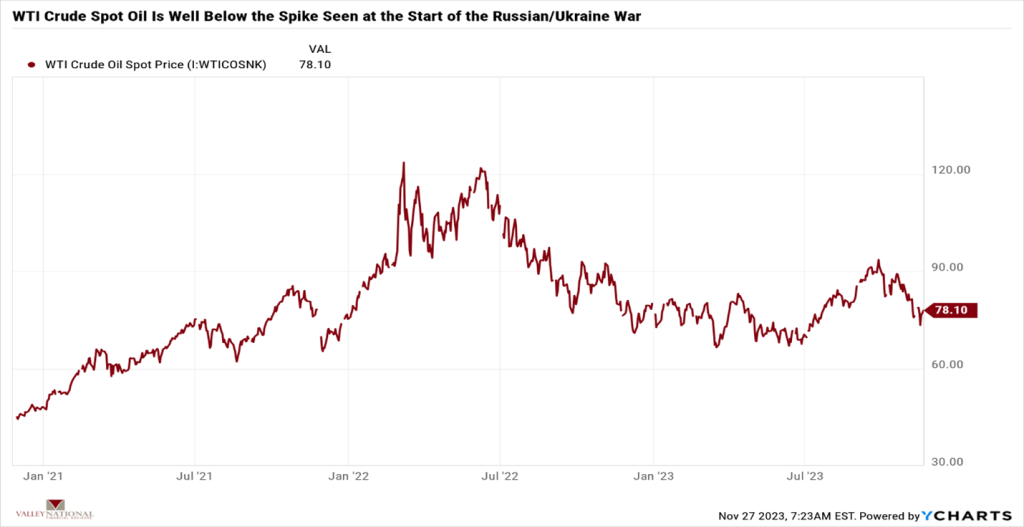
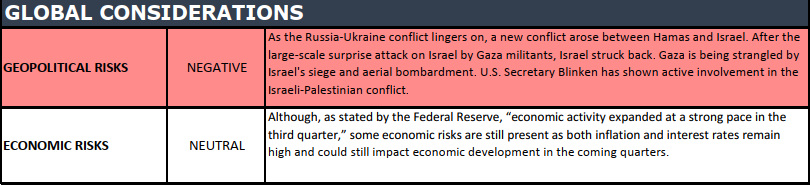
While global unrest and turmoil continue with the Russia/Ukraine and Israel/Hamas war, both conflicts remain regional and have not yet spilled over into 1) a greater European region or 2) the larger Middle East, as #1 could impact oil, natural gas, and food prices and #2 could impact oil prices. Both situations remain horrible humanitarian events and will eventually garner sufficient international pressure to resolve the conflicts. As mentioned, the impact on oil prices from either conflict has been minimal, at least since the initial spike in March 2022. Oil is a key ingredient in many industrial and consumer materials well beyond simply energy. A falling oil price goes a long way in the continued inflation fight. See Chart 1 below from Valley National Financial Advisors and Y Charts showing the price of a barrel of oil.
Global and US Policy and Politics
U.S. politics have reached their yearly quiet period where lawmakers, having passed budget resolutions until early 2024, return to their home states and families for the holidays. Politics are not so sanguine in China, where profit growth is slowing in their industrial sector even as greater housing stimulus continues. According to the Chinese National Bureau of Statistics, industrial profits increased by +2.7% in October from 2022, versus increases of +11.9% in September and +17.2% in August. China is the world’s second-largest economy and remains important to the U.S. and elsewhere.
What to Watch
U.S. Real GDP (Gross Domestic Product) QoQ (Quarter Over Quarter) for Q3 2023, released 11/29, prior rate 4.9%
U.S. Core PCE (Personal Consumption Expenditure) Price Index YoY (Year Over Year) for October 2023, released 11/30, prior rate 3.68%
U.S. PCE Price Index YoY for October 2023, released 11/30, prior rate 3.44%
U.S. Initial Claims for Unemployment for week of 11/25/23, released 11/30, prior 209,000.
We had a quiet, holiday-shortened week last week, but the markets continued their November rally with all major sectors participating. Early thoughts from retailers are that Black Friday sales were strong, and early Cyber Monday sales look to be strong as well. Is this the start of the “Santa Claus Rally?” As readers of The Weekly Commentary know, we do not invest in short-term rallies or bank on Santa Claus for market returns. We preach the importance of long-term investing, ignoring the noise from Wall Street, and sticking to your investment plan; any help from Santa is just gravy for investors. There are few
Sources: Index Returns: Morningstar Workstation. Past performance is no guarantee of future results. Indices are unmanaged and cannot be invested into directly. Three, five- and 10- yearreturns are annualized excluding dividends.Interest Rates: Federal Reserve, Mortgage Bankers Association.
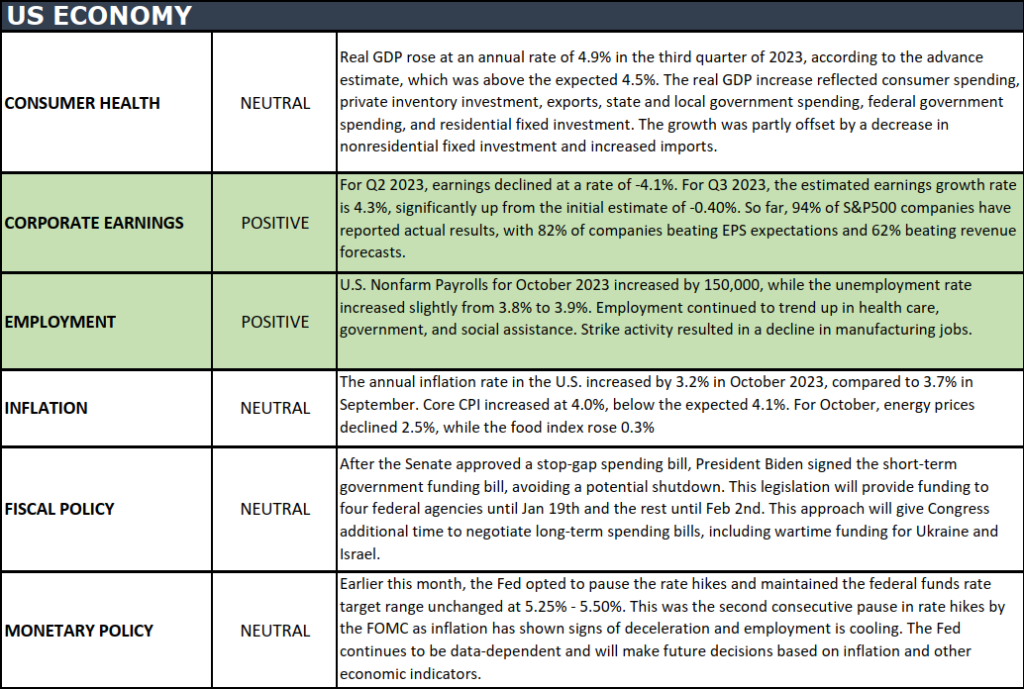
MARKET HEAT MAP
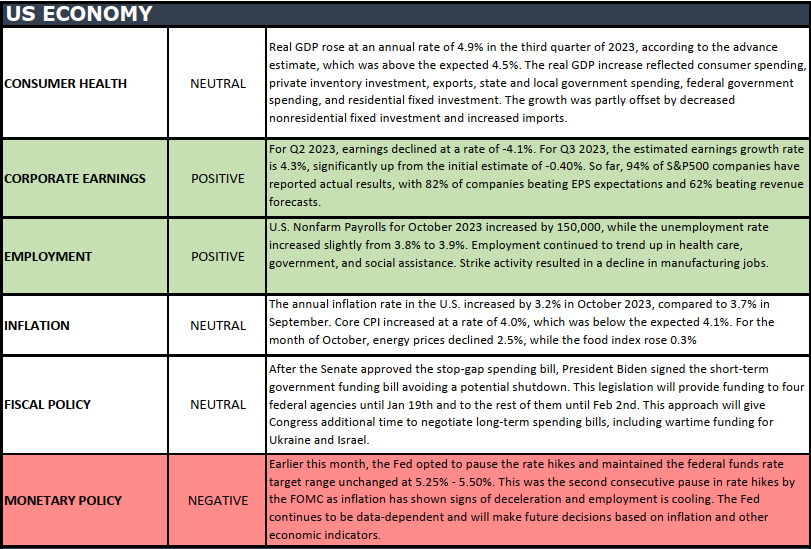
The health of the U.S. economy is a key driver of long-term returns in the stock market. Below, we grade key economic conditions that we believe are of particular importance to investors.
The “Heat Map” is a subjective analysis based upon metrics that VNFA’s investment committee believes are important to financial markets and the economy. The “Heat Map” is designed for informational purposes only and is not intended for use as a basis for investment decisions.
Questions can be submitted at yourfinancialchoices.com in advance of the live show. Recordings of past shows are available to listen or download at both yourfinancialchoices.com and wdiy.org.
The VNFA Team is thrilled to participate in the 2023 Volunteer Center Holiday Hope Chests, marking a joyous occasion to deliver smiles and laughter within beautifully packed shoeboxes.
The Volunteer Center makes it easy for anyone that wants to participate and bring extra smiles to kids in our community. Team VNFA is happy to share a little joy this year. If you are interested in being part of this amazing cause visit the Volunteer Center of the Lehigh Valley.
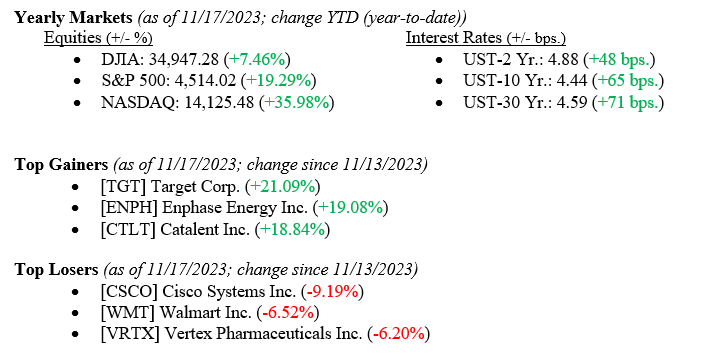
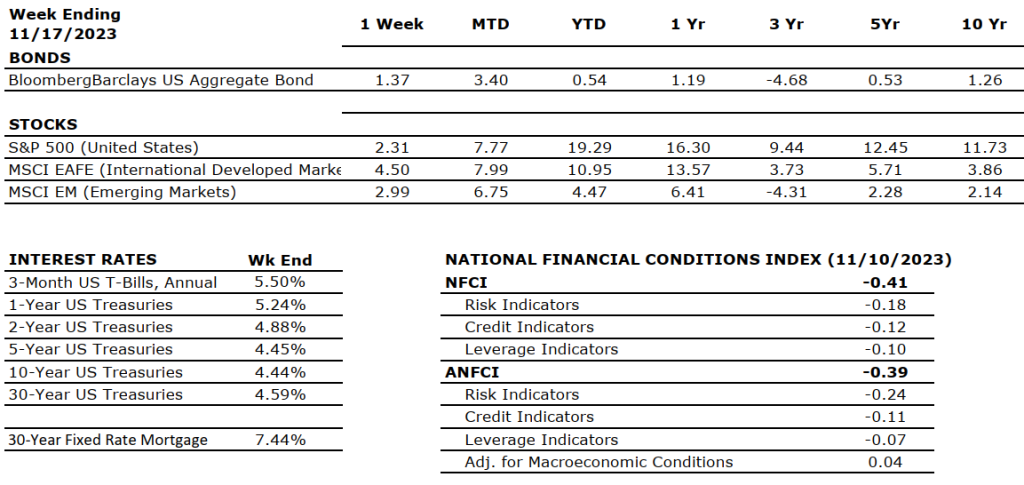
Equity markets notched another modest win last week, with all major indexes reporting gains (see year-to-date numbers below). We typically only point out the major indexes here at Valley National Financial Advisors, but last week saw gains in small capitalization stocks, a sector left out of this year’s market rally. As measured by the Russell 2000 Index, small caps gained +5.5% last week, which also shifted their year-to-date return into positive territory at +3.5%. A rally in small-cap stocks has been long overdue as most of the big gains this year have been in large-cap and even mega-cap stocks like the “Magnificent Seven.” An equity market rally balanced across all sectors and includes deep depth and breadth of all capitalization stocks rather than just large or mega-cap is healthier and more sustainable over longer periods. Bonds also continued their rally, with the 10-year U.S. Treasury falling 18 basis points to close the week at 4.44%.
US Economy
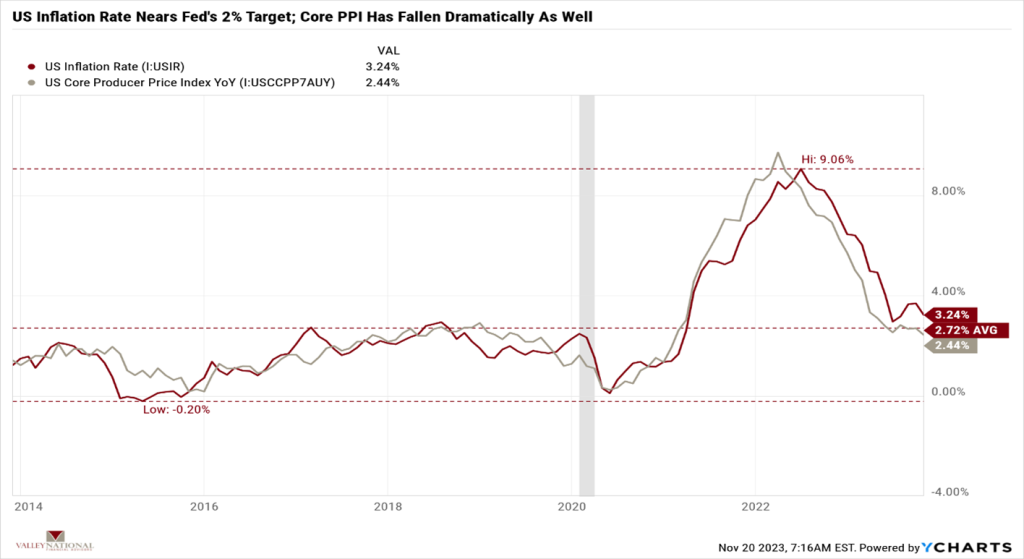
Last week’s equity gains were precipitated by the inflation data released mid-week. The U.S. Inflation Rate fell to 3.24% for October, down from an August 2022 high of 9.06%. See Chart 1 below from Valley National Financial Advisors and Y Charts showing the U.S. Inflation Rate and the U.S. Core Producer Price Index. While the U.S. inflation rate is not yet at the Federal Reserve’s target rate of 2%, the rate has come down dramatically. Furthermore, as we have stated many times here at Valley National Financial Advisors, interest rate hikes take time to work their way through the economy; therefore, even without further rate increases, the inflation rate should continue to track downward from here, given all the tightening that has occurred over the past 18 months. This view, shared by most economists, confirms that the Fed will remain on the sidelines, refraining from further intervention and instead watching and interpreting the data.
Policy and Politics
We have talked about global turmoil often and how global issues create uncertainty and fear—both of which markets hate. The Ukraine/Russia War continues to languish well into its second year. Further, the Israel/Hamas War shows no signs of abating. Thankfully, last week’s APEC Summit in San Francisco and the meeting of Chinese President Xi Jinping and President Biden may help to revive the recently cool relations between China and the U.S., the world’s two largest economies. Both countries are moving past pandemic-related inflation periods and experiencing growing economies, so healthy relationships rather than trade wars or tariff spats are important going forward.
What to Watch
We have a Thanksgiving Holiday shortened trading week so Wall Street will be quiet but Main Street will be all buzz on Friday as the Holiday Season will kick off with Black Friday sales hitting the retail space. Next week Cyber Monday starts and by the end of the week we will have some idea of the consumer’s appetite for shopping and spending as many retailers will report 3rd quarter earnings.
Everyone agrees that the U.S. has avoided a recession in 2023, and the outlook for 2024 is starting to look equally rosy. We remain cautiously optimistic about the markets and the economy, as we have been for over a year. The Fed may be done with interest rate hikes, but even if more hikes are coming, they will be modest, if at all, and minimally impactful. Investors have been rewarded this year for staying the course and remaining invested, a path that is often painful. According to the Nation Retail Federation, consumer spending is expected to be 3-4% higher this holiday season. The U.S. consumer has remained resilient all year and continues to support the economy. Reach out to your financial advisor at Valley National Financial Advisors for help and advice, but more importantly, enjoy the Thanksgiving Holiday Weekend.
Sources: Index Returns: Morningstar Workstation. Past performance is no guarantee of future results. Indices are unmanaged and cannot be invested into directly. Three, five- and 10- yearreturns are annualized excluding dividends.Interest Rates: Federal Reserve, Mortgage Bankers Association.
MARKET HEAT MAP
The health of the U.S. economy is a key driver of long-term returns in the stock market. Below, we grade key economic conditions that we believe are of particular importance to investors.
The “Heat Map” is a subjective analysis based upon metrics that VNFA’s investment committee believes are important to financial markets and the economy. The “Heat Map” is designed for informational purposes only and is not intended for use as a basis for investment decisions.