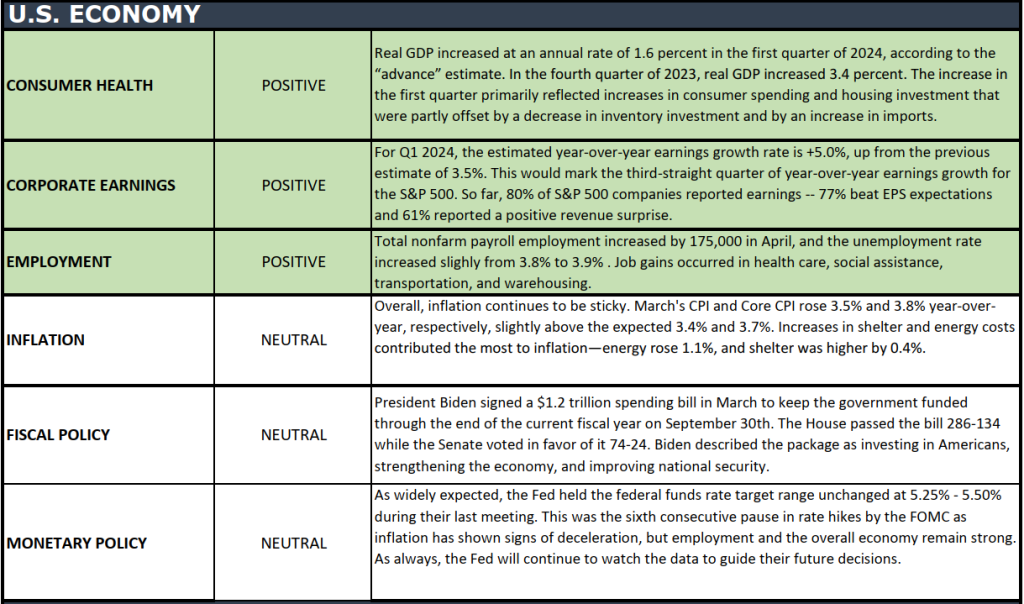
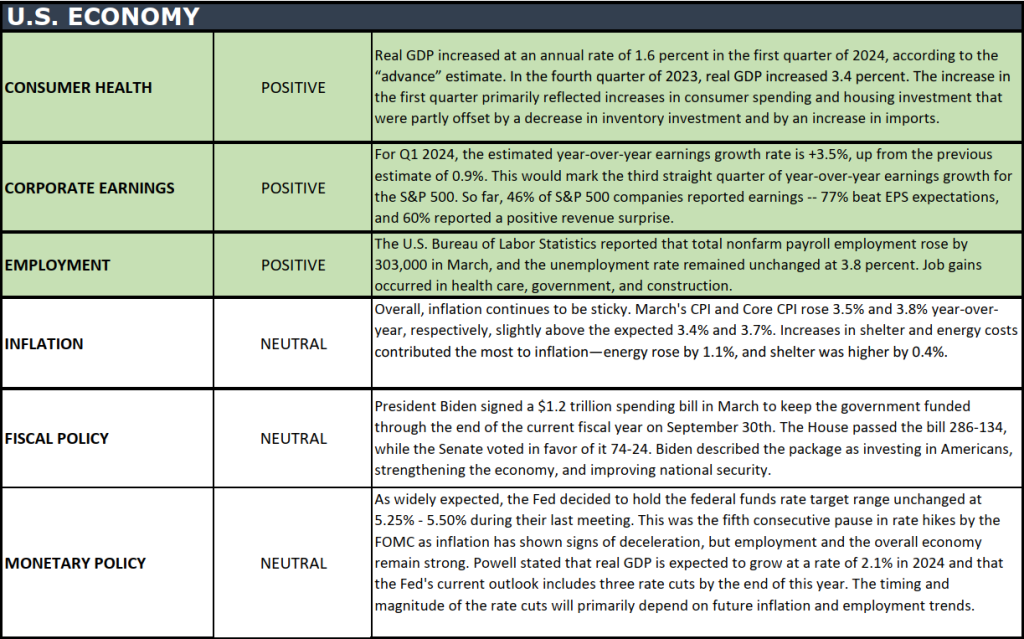
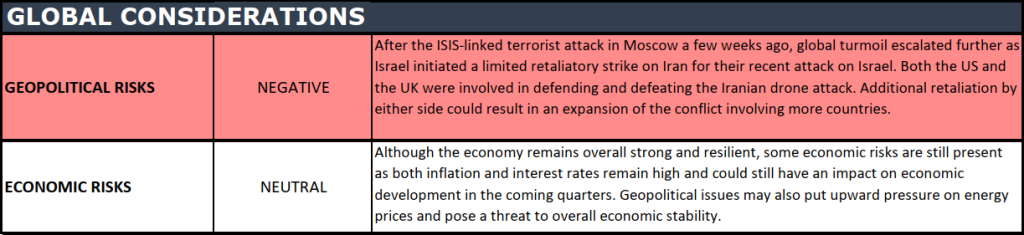
The health of the U.S. economy is a key driver of long-term returns in the stock market. Below, we grade key economic conditions that we believe are of particular importance to investors.
The “Heat Map” is a subjective analysis based upon metrics that VNFA’s investment committee believes are important to financial markets and the economy. The “Heat Map” is designed for informational purposes only and is not intended for use as a basis for investment decisions.
Cinco de Mayo isn’t Mexico’s Independence Day; rather, it honors the Battle of Puebla on May 5, 1862.
Cinco de Mayo is known to symbolize resilience because the Mexican army won over the French at Puebla despite being outnumbered.
Celebrated globally, Cinco de Mayo is a significant event in Mexico and the U.S. Cinco de Mayo is also celebrated globally, from Canada to Australia and even Japan!
Margaritas, mariachis, tacos, and salsa are indispensable elements for a Cinco de Mayo celebration.
Philadelphia holds the record for the largest piñata, measuring an impressive 61 feet in length.
So, whether you’re enjoying tacos with friends or celebrating at home, let’s celebrate the lively essence of Cinco de Mayo with a toast!
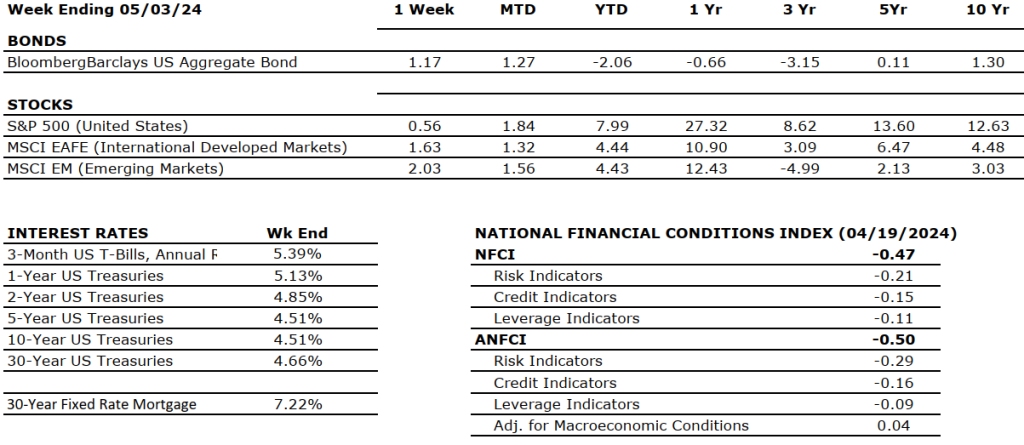
Amidst a flurry of earnings reports, the release of the first-quarter GDP, and updates on inflation, investors endured a week of volatility. Despite this, stocks rebounded with tech sector strength, buoyed by robust corporate profits and steady economic growth, albeit at a slower pace. For the week, the Dow Jones Industrial Average rose 0.7%, the S&P 500 Index rose 2.7%, and the NASDAQ rose 4.2%. Information technology was the best-performing sector for the week (+5.1%), while energy was the worst-performing sector (+0.7%). This week, 37% of S&P 500 companies reported quarterly earnings, including Magnificent Seven tech stocks, including Google, Meta (Facebook), Microsoft, and Tesla. About one-third of the 229 companies reported exceeded sales expectations, while two-thirds beat earnings per share (EPS) estimates, with an average surprise of 9%. GDP growth slowdown tempered by resilient domestic demand and stagnant inflation are likely influencing the Fed’s cautious stance. Yields of U.S. government bonds rose for the fourth week in a row. The 10-year U.S. Treasury closed the week at 4.67%, five basis points higher than the previous week.
U.S. & Global Economy
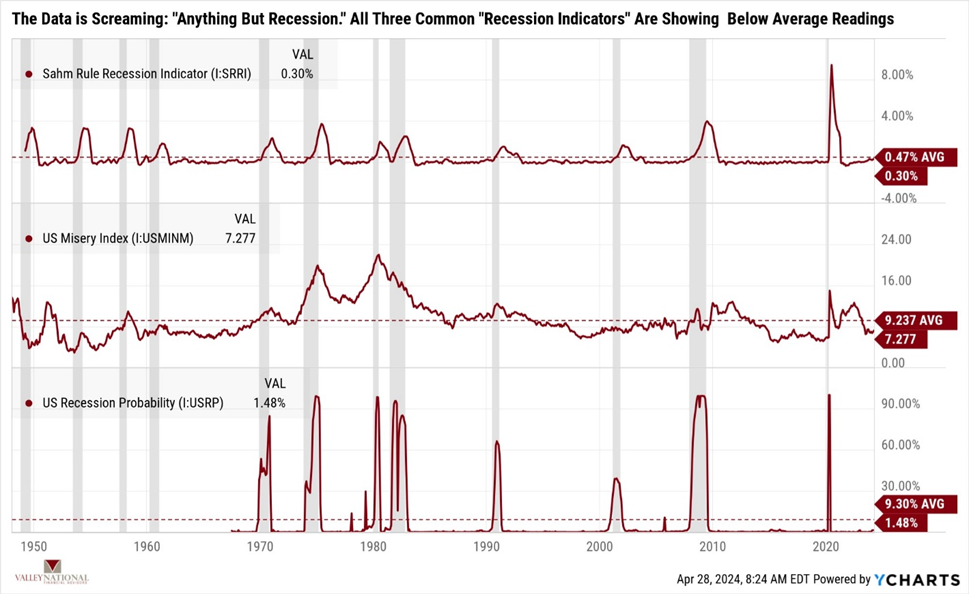
The resilience of the U.S. economy in the face of much higher interest rates has been one of the biggest surprises of the past two years. As recently as last year, most economists were expecting a recession, and we have seen anything but. See Chart 1 below from Valley National Financial Advisors and YCharts, which shows three common recession indicators: The Sahm Rule, The Misery Index, and the Probability of a U.S. Recession. While we understand it is a busy chart, the message is simple: the data is not telling us we are nearing a recession. The data is screaming growth ahead.
The U.S. economy continues to grow healthy despite a dramatic rise in the Fed Funds Rate to its current range of 5.25% to 5.50%, a 23-year high. We understand the reasons for the recent interest rate hikes; inflation was over 9%, but it has fallen to just over 3%. The last move towards the Fed’s target of 2% is taking a bit longer than some expected. Still, the markets thus far have been correct in seeing the real message: growth is continuing, inflation is coming down, and corporate earnings have been steady.
While the U.S. is clearly growing at a respectable clip, global growth is continuing elsewhere as well. According to the A.P. News, the International Monetary Fund (IMF) upgraded 2024’s global outlook, saying the world is headed toward the elusive “soft landing.” The IMF predicts a 3.2% global expansion this year and sees global inflation falling to 5.9% in 2024, down from 6.8% in 2023. We expect growth to continue at a measured pace and inflation to continue to fall at the same measured pace.
Policy and Politics
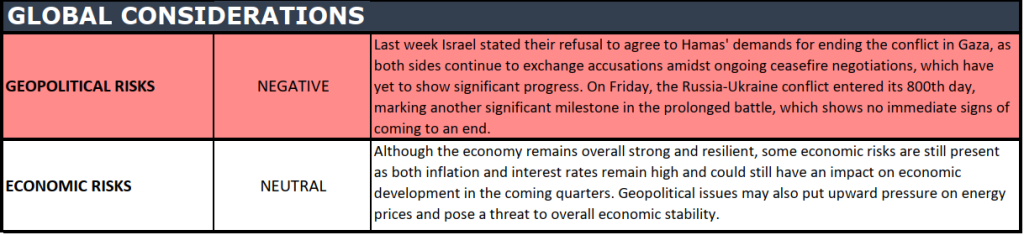
Local, national, and global unrest around wars and politics is stoking fear and uncertainty, which can permeate the markets. But the data – earnings, employment, housing – tells another story –expansion and growth. College campus unrest also continues throughout the U.S., but we have seen this story before, and with the school year coming to an end soon and students leaving campus, it is likely that these protests will dwindle down as well. However, the wars and unrest around the world will continue throughout the summer, and with the presidential election this fall, that will be anything but easy on the U.S.
Economic Numbers to Watch This Week
Target Fed Funds Rate announced, current 5.50%
U.S. Job Openings Non-farm for March ‘24, prior 8.756M
U.S. Initial Claims for Unemployment Insurance for the Week of April 27, 2024, prior 207,000.
U.S. Labor Force Participation Rate for April 2024, prior to 62.7%
U.S. Unemployment Rate for April 2024, prior to 3.8%
As markets gear up for another wave of quarterly earnings releases, the week ahead holds some key events, including a U.S. Federal Reserve policy meeting and the eagerly awaited April jobs report. Investors are curious to see if April’s job growth matches March’s surprisingly strong increase. Against the backdrop of ongoing market ups and downs driven by inflation fears and economic data swings, tech stocks are lending some strength to the market, even as the broader economy shows signs of cooling off. All eyes will be on Apple and Amazon when they report their quarterly earnings this week. Please reach out to your advisor at Valley National Financial Advisors with any questions.
Questions can be submitted to yourfinancialchoices.com before the live show. Recordings of past shows are available to listen to or download at yourfinancialchoices.com and wdiy.org.
Did you miss the last show, Financial Education Resources? Listen Here
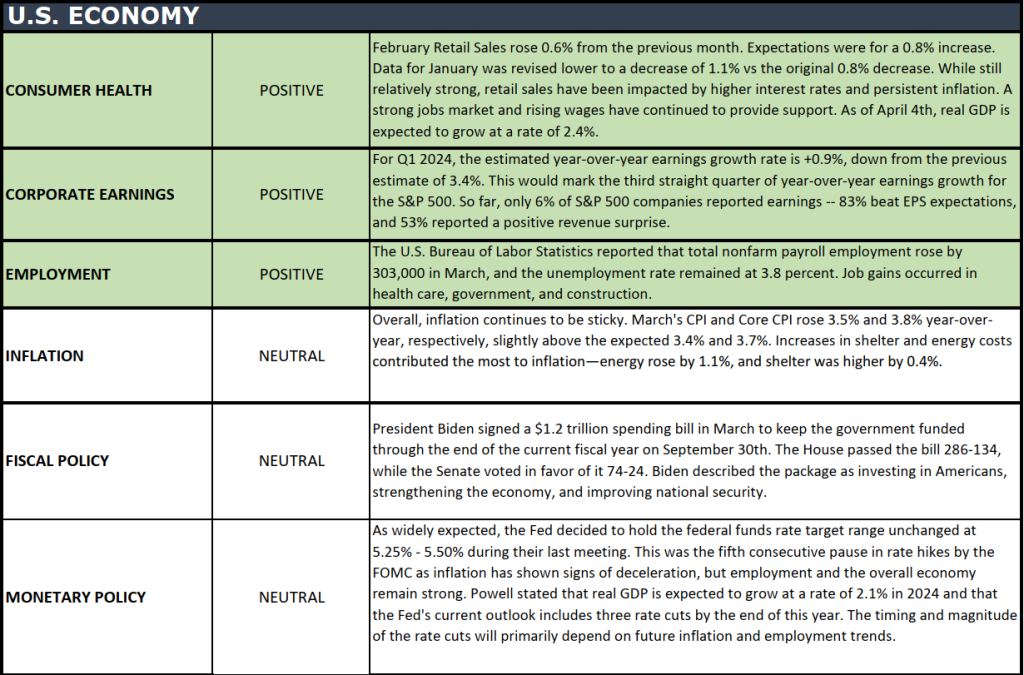
The health of the U.S. economy is a key driver of long-term returns in the stock market. Below, we grade key economic conditions that we believe are of particular importance to investors.
The “Heat Map” is a subjective analysis based upon metrics that VNFA’s investment committee believes are important to financial markets and the economy. The “Heat Map” is designed for informational purposes only and is not intended for use as a basis for investment decisions.
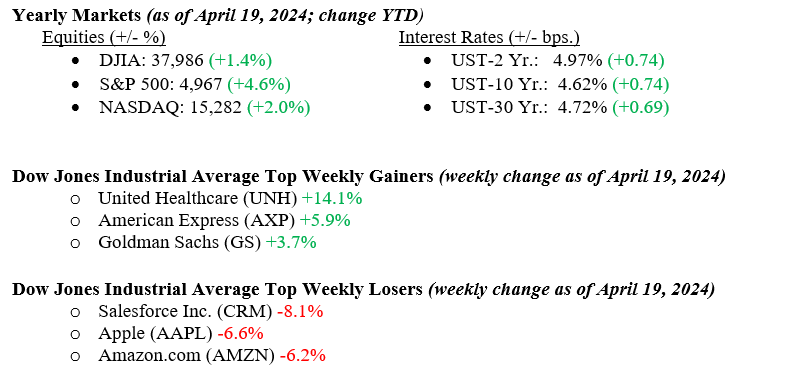
With so much global unrest and uncertainty hanging over the markets and the Fed clearly on hold for a bit longer with rate cuts, risk assets needed a reason to sell off. We got that last week with Israel’s retaliatory strike on Iran. While the strike seemed limited in scope, the risk of further escalation now hangs over the markets. Oddly, U.S. Treasuries, which typically would rally during global unrest, sold off as the Fed’s position on rates outweighed the troubles in the Middle East. The 10-year U.S. Treasury closed the week at 4.62%, 12 basis points lower than the previous week.
U.S. Economy
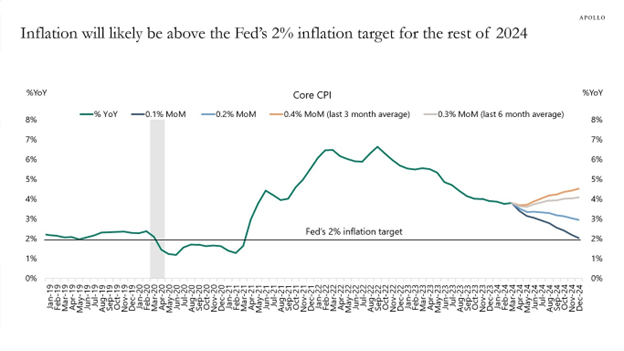
Interest rates continue to rise as they have all year, and we believe the current elevated rates will remain at this level for quite some time for three simple reasons. First, the economy continues to surprise on the upside with steady growth and expansion. Second, the labor market remains strong, with an unemployment rate near a 50-year low of 3.8% (BLS – Bureau of Labor Statistics). Third, inflation has not reached the Fed’s 2% target and, conversely, could remain above their target for 2024. See Chart 1 below from Apollo showing potential paths for inflation into year-end 2024.
Policy and Politics
As the latest escalation settles down, we expect markets to follow suit and settle down as well, but further retaliation from either side would force a flight to safety and quality, and we would expect U.S. Treasuries to rally and yields to fall as a result, so stay tuned!
In nationwide polls, President Biden and former President Trump are neck and neck. Still, Biden lags by approximately three percentage points in the crucial swing states that could determine the electoral victory. According to Prediction Markets, there is a 55% probability of a Democratic triumph.
Economic Numbers to Watch This Week
U.S. Durable Goods New Orders MoM for March 2024, prior 1.37%
U.S. Real GDP (Gross Domestic Product) for 1st Quarter 2024, prior 3.4%
U.S. claims for Unemployment Insurance for the week of April 20, 2024, prior to 212,000
U.S. Core PCE (Personal Consumption Expenditures) Price Index YoY for March 2024, prior 2.78%
U.S. PCE Price Index YoY for March 2024, prior 2.45%
U.S. Index of Consumer Sentiment for April 2024, prior 77.90
Following a strong stock market rally over the last six months, recent weeks have seen a softening trend. Market corrections are typical, and three main drivers of recent volatility have emerged: a reevaluation of Fed rate cut expectations, escalating geopolitical tensions, and ongoing first-quarter earnings season concerns. Despite market adjustments, the extent of the pullback has been contained against a still healthy macroeconomic picture and corporate earnings growth. We remain optimistic as CEO confidence is on the rise, indicating a greater willingness among firms to allocate more capital this year compared to last year. This confidence typically translates into increased hiring and investment in capital expenditures. Please reach out to your advisor at Valley National Financial Advisors with any questions.
Tune in Wednesday, 6 PM, “Your Financial Choices” on WDIY 88.1 FM. Laurie will be discussing:Financial Education Resources.
Questions can be submitted to yourfinancialchoices.com before the live show. Recordings of past shows are available to listen to or download at yourfinancialchoices.com and wdiy.org.
Did you miss the last show, Financial Concepts to Know, with guest Bill Henderson, Chief Investment Officer at Valley National Financial Advisors? Listen Here
The health of the U.S. economy is a key driver of long-term returns in the stock market. Below, we grade key economic conditions that we believe are of particular importance to investors.
The “Heat Map” is a subjective analysis based upon metrics that VNFA’s investment committee believes are important to financial markets and the economy. The “Heat Map” is designed for informational purposes only and is not intended for use as a basis for investment decisions.