The Volunteer Center of the Lehigh Valley Volunteer Challenge is TONIGHT! #TeamVNFA will be there! Will we see you at the event?

There is still time to cast your votes. https://www.volunteerlv.org/poll-organizations

The Volunteer Center of the Lehigh Valley Volunteer Challenge is TONIGHT! #TeamVNFA will be there! Will we see you at the event?
There is still time to cast your votes. https://www.volunteerlv.org/poll-organizations
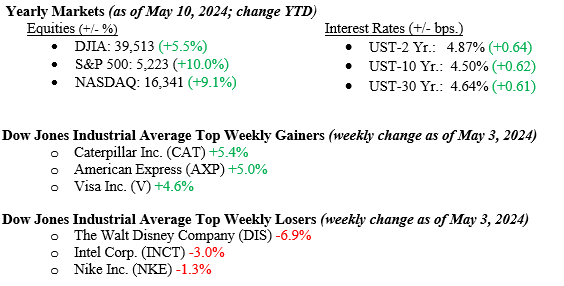
For the week of May 10th, the Dow Jones Industrial Average rose 2.2%, the S&P 500 Index rose 1.9%, and the NASDAQ rose 1.2%. Utilities were the best-performing sector for the week (+4.1%), while consumer discretionary was the worst-performing sector (+0.2%). The labor market experienced a minor setback last week, as weekly unemployment claims rose to 231,000 from 209,000 the prior week. This follows the unexpectedly weak non-farm payroll growth and unemployment rate reported for April. Readings like this will hopefully support the Federal Reserve in commencing interest rate cuts this summer. The 10-year U.S. Treasury closed the week at 4.50%, unchanged from the previous week.
U.S. & Global Economy
Last week was quiet on the U.S. economic data front. The most notable data points for the week were the weaker-than-anticipated jobless claims number reported on Thursday and Friday’s preliminary reading of consumer sentiment for May, which was weaker than expected. Later this week, all eyes will be on a fresh batch of inflation numbers scheduled to be reported. The Producer Price Index will be reported on Tuesday, with the Consumer Price Index set to be reported on Wednesday. We note below why the data will hang heavily on the Biden administration and their reelection hopes.
Policy and Politics
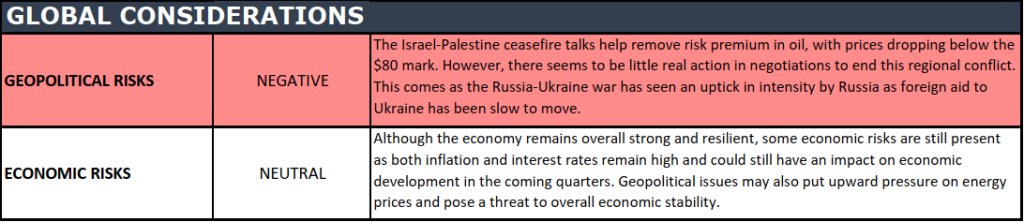
We are encouraged to see Israel-Palestine ceasefire talks help remove risk premium in oil, with prices dropping below the $80 mark. However, there seems to be little real action in negotiations to end this regional conflict. This comes as the Russia-Ukraine war has seen an uptick in intensity by Russia as foreign aid to Ukraine has been slow to move.
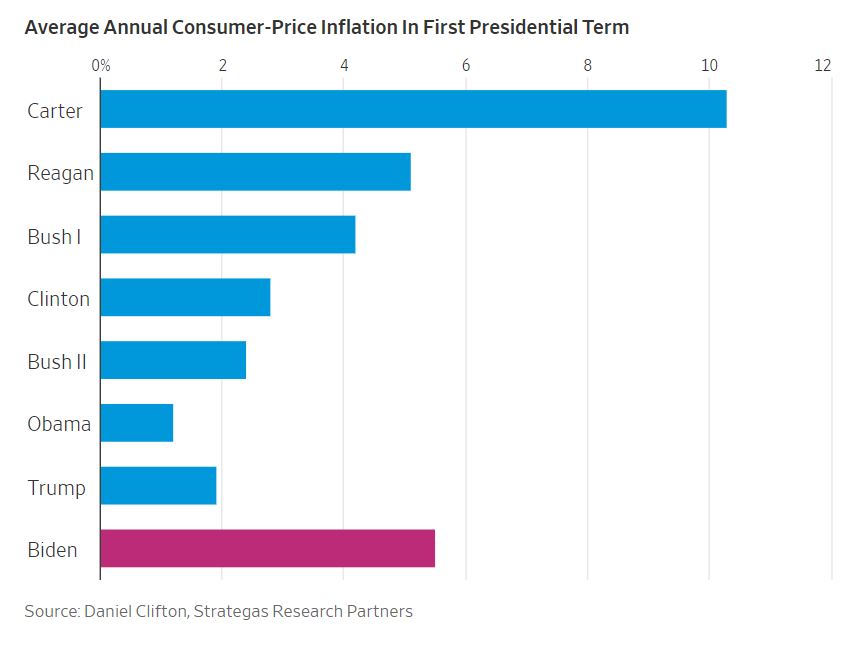
We have shown in the past that regardless of which party is in the White House, stock markets rally when the economy is growing and doing well. However, in elections, data matters, and the inflation problem continues in our economy, with the final path to 2% inflation continuing to be difficult to attain. See Chart 1 below from Dan Clifton at Strategas and the Wall Street Journal, showing the average annual CPI (Consumer Price Index) Inflation during the past eight Presidential first terms. Other President Carter had a higher reading. While it is fair to say the COVID-19 pandemic wreaked havoc on inflation, legislative and administration actions during President Biden’s first term pumped $7.2 trillion into the economy, eventually creating strong demand for goods and services. The inflation story will become more important as we move closer to November.
Economic Numbers to Watch This Week
Despite the potential for volatility in the coming months stemming from uncertainties around the Federal Reserve’s interest rate outlook and looming concerns over the U.S. presidential elections, market gains continue to be buoyed by the upward trend in corporate earnings. 90% of S&P 500 companies have reported first-quarter earnings, and the results have thus far exceeded analysts’ expectations by 8.5%. According to FactSet, the Wall Street analysts lifted their earnings-per-share estimates for second-quarter results by 0.7%. Remember, when companies make money, they make capital expenditures, pay dividends, buy back stock, and hire employees. Follow the data but proceed cautiously. Please contact your advisor at Valley National Financial Advisors with any questions.

MARKET HEAT MAP
The health of the U.S. economy is a key driver of long-term returns in the stock market. Below, we grade key economic conditions that we believe are of particular importance to investors.
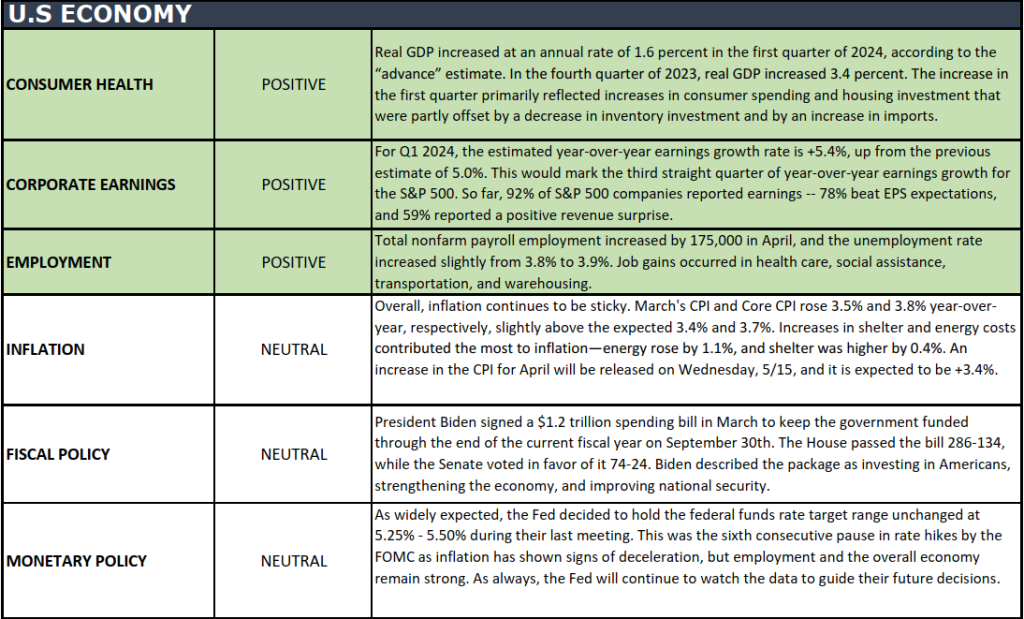
The “Heat Map” is a subjective analysis based upon metrics that VNFA’s investment committee believes are important to financial markets and the economy. The “Heat Map” is designed for informational purposes only and is not intended for use as a basis for investment decisions.
Tune in Wednesday, 6 PM, “Your Financial Choices” on WDIY 88.1 FM. Laurie will be discussing: Education Funding and FAFSA.
Questions can be submitted to yourfinancialchoices.com before the live show. Recordings of past shows are available to listen to or download at yourfinancialchoices.com and wdiy.org.
Did you miss the last show, Supercharging Your Gifting as Part of Your Estate Planning? Listen Here
#TeamVNFA is seeking a Financial Technology Operations Associate to work as part of our Operations team.
Read more about this opportunity: https://valleynationalgroup.isolvedhire.com/jobs/1187362-360347.html
“Life is either a daring adventure or nothing at all.” – Helen Keller
Voting is open for the Volunteer Center of the Lehigh Valley Volunteer Challenge. #TeamVNFA partnered with Pleasure of Your Company Therapy Dogs (POYC) for the 2024 Volunteer Challenge! Pleasure of Your Company (POYC) Therapy Dogs is a nonprofit organization dedicated to sharing the benefits of pet therapy by visiting community members who are unable to own dogs themselves. Their certified therapy dog teams regularly visit senior living communities, nursing homes, hospice facilities, schools, universities, hospitals, and beyond.

Click the link to see more details of our project and vote: https://www.volunteerlv.org/poll-organizations
Join our team! #TeamVNFA is seeking a Financial Technology Operations Associate to work as part of our Operations team.

Read more about this opportunity: https://valleynationalgroup.isolvedhire.com/jobs/1187362-360347.html
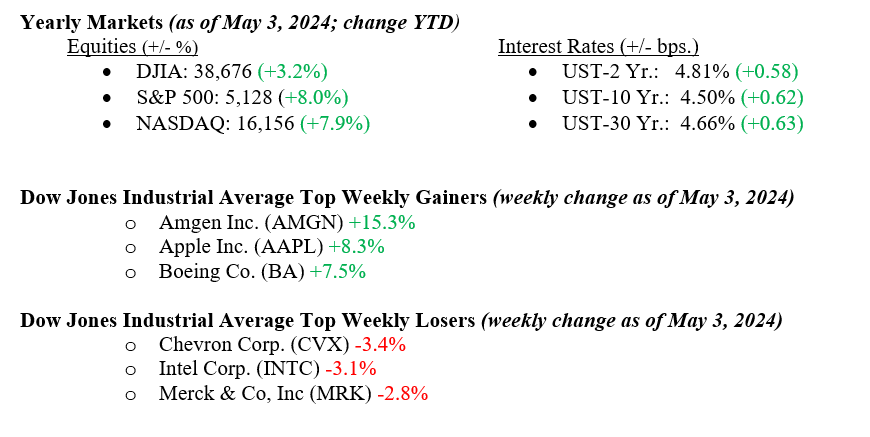
For the week, the Dow Jones Industrial Average rose 1.1%, the S&P 500 Index rose 0.6%, and the NASDAQ rose 1.4%. Utilities were the best-performing sector for the week (+3.4%), while energy was the worst-performing sector (-3.3%). Following Wednesday’s FOMC decision to leave rates unchanged, markets felt relieved that the Fed indicated it is not currently considering raising rates. Chair Powell described the current monetary policy as appropriate for handling appropriate scenarios. Overall, it is reassuring to see companies delivering robust earnings, with an impressive 79% surpassing analysts’ projections, resulting in an average upside surprise of almost 9%. The 10-year U.S. Treasury closed the week at 4.50%, a stunning 17 basis points lower than the previous week, showing that traders are finally accepting the next move the Fed will be to lower rates.
U.S. & Global Economy
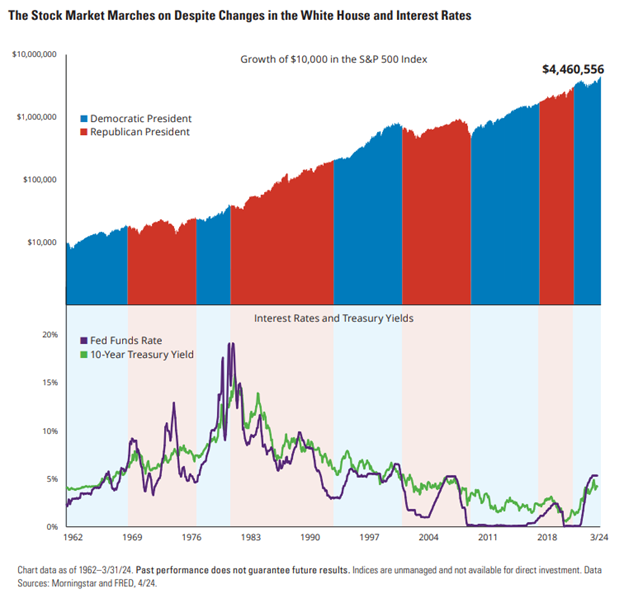
Certainly, all investors know we have a U.S. presidential election in November of this year. It is normal to have investor anxiety around events like this. Still, the markets are more efficient than investors, and the markets seem to understand that either outcome in November is a known commodity one way or another. Major elections and changes to interest rates can be two of the most unsettling things investors face. However, through presidents from both parties and countless interest-rate changes, the stock market has been resilient and has taken these changes in stride. See Chart 1 from Hartford, Morningstar, and the Federal Reserve Bank, which shows the growth in the S&P 500 and the Fed Funds Rate over the past 60+ years and multiple changes in administration showing the growth in the S&P 500 and the Fed Funds Rate over the past 60+ years and multiple changes in administrations.
Policy and Politics
Last week, Israel stated their refusal to agree to Hamas’ demands for ending the conflict in Gaza, as both sides continue to exchange accusations amidst ongoing ceasefire negotiations, which have yet to show considerable progress. On Friday, the Russia-Ukraine conflict entered its 800th day, marking another significant milestone in the prolonged battle, which shows no immediate signs of ending.
Economic Numbers to Watch This Week
Markets do not move in a straight line. After five consecutive monthly gains, markets moved lower in April, with the S&P 500 down by 4.2%. Despite moderation in the first quarter of GDP (Gross Domestic Product) and a slight cooling in job growth for the month of April, we continue to see the U.S. economy on solid footing. It is promising to see earnings growth and performance leadership broadening beyond the popular mega-cap tech stocks. This builds a sturdy base for the market to continue to move higher. Please contact your advisor at Valley National Financial Advisors with any questions.
Tune in Wednesday, 6 PM, “Your Financial Choices” on WDIY 88.1 FM. Laurie will be discussing: Supercharging Your Gifting As Part of Your Estate Planning.
Questions can be submitted to yourfinancialchoices.com before the live show. Recordings of past shows are available to listen to or download at yourfinancialchoices.com and wdiy.org.
Did you miss the last show, Navigating Transitions – Marriage, Divorce, Retirement, Death of a loved one? Listen Here