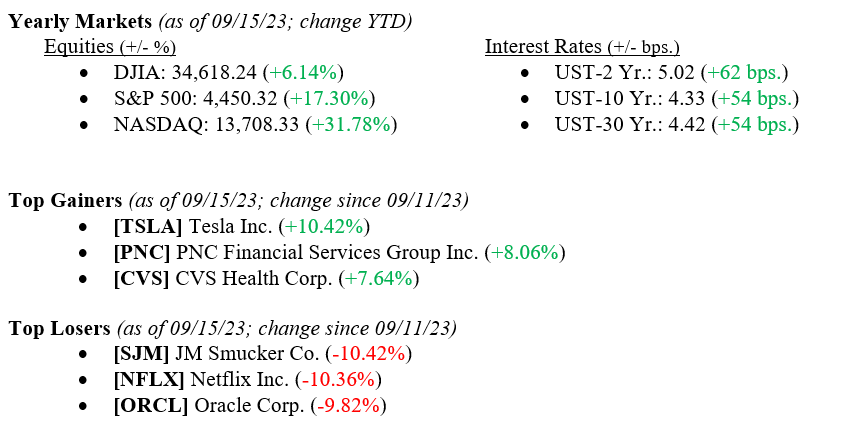
U.S. stocks ended the week essentially flat. The Dow Jones Industrial Average gained 0.12% on the week, the S&P 500 lost 0.16%, and the NASDAQ fell 0.39%. Last week, U.S. inflation grew to 3.67% from 3.18% the month prior. Additionally, mortgage rates climbed to an average of 7.18% from 7.12%, the highest rate since May 2001. It’s also worth noting that the Index of Consumer Sentiment, a survey of general economic outlook based on a random sample of U.S. households, has fallen to 67.70, a slight drop from the prior month but still significantly ahead from a year ago when it was 58.60 (the higher consumer sentiment, the better). These reports coincide with a slight sell-off in bonds, with the 10-year U.S. Treasury ending the week at 4.33%, seven basis points higher than last Friday. As always, please reach out to your advisor at Valley National Financial Advisors with any questions or concerns.
Global Economy
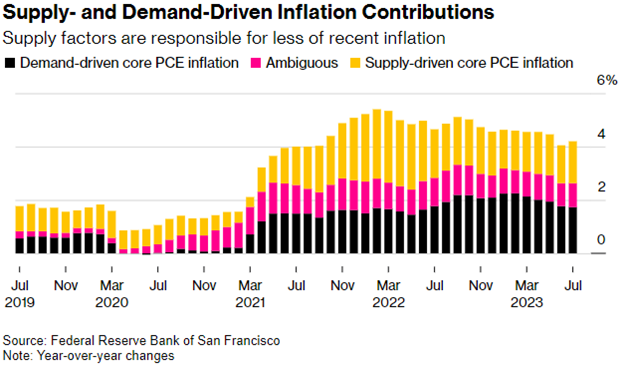
Though the Federal Reserve has raised rates by more than 500 basis points since January 2022, there has been a limited slowdown in US consumer demand. With the most recent inflation number gaining month-over-month, policymakers are beginning to look at rates from a new perspective: what do rate hikes mean for the supply side of the economy? The argument is that if rates rise too high, they could potentially undermine the benefits of increasing supply, as discussed in a paper presented at Jackson Hole last month. Despite this, we expect the Fed to remain data-driven in its battle to bring inflation down to the 2% target—it is unlikely that they will act solely on this argument moving forward when their action plan has proven relatively effective. Chart 1 below shows the components of inflation that are driven by either demand or supply.
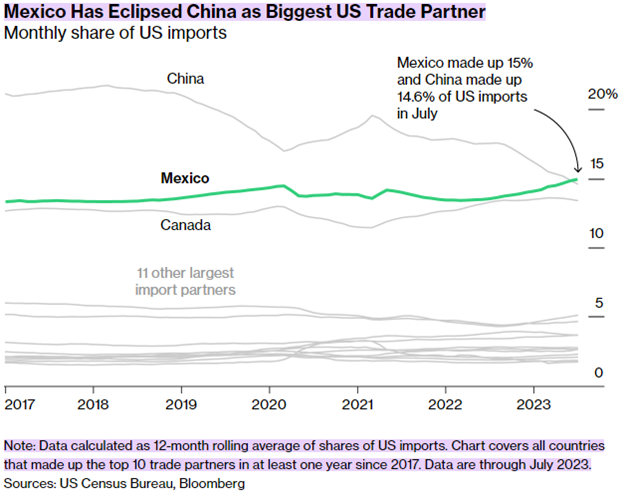
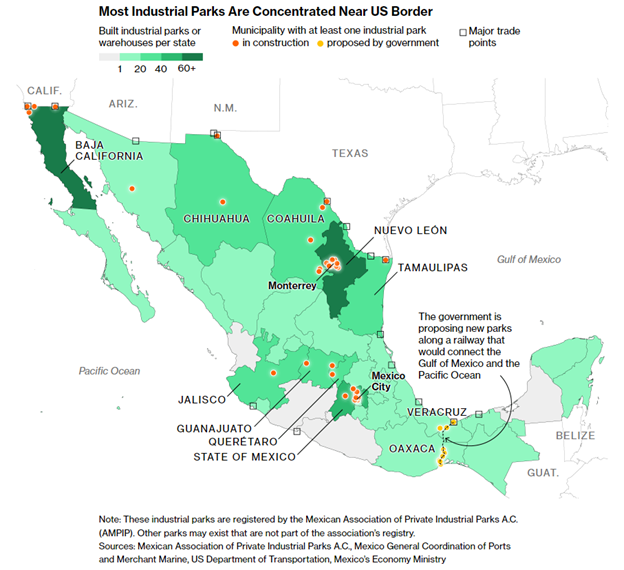
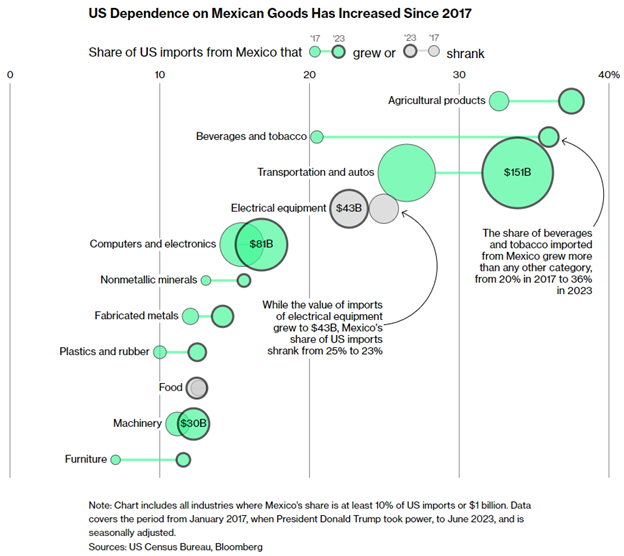
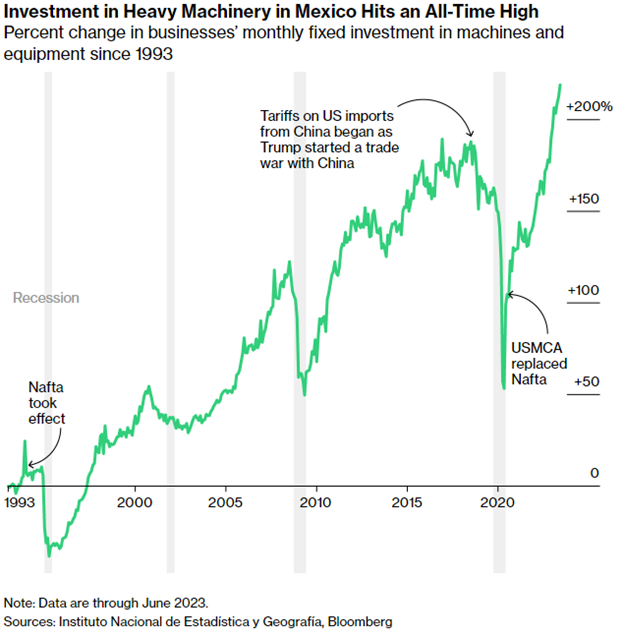
As of July, Mexico has overtaken China as the United States’s largest trade partner, representing 15% of U.S. imports (versus China’s 14.6%). Chart 2 below shows the trend in U.S. imports since 2017. As U.S.-China relations soured, the share of imports from Mexico and Canada increased significantly over the last six years, making nearshoring to Mexico a much more attractive option. Chart 3 is a map of major industrial parks that produce goods that eventually make their way into the United States—it’s no surprise that most of them are located near the border. As investment into these industrial parks increased, so did the U.S.’s dependence on Mexican goods. Since 2017, all categories of imports have increased except for food and electrical equipment, which decreased. Chart 4 shows each import category and their respective sizes. Chart 5 shows the change in investment in heavy machinery in Mexico since 1993—notice the sharp decline from when tariffs on Chinese goods began in 2018 through 2020 and then the sharp rise once the USMCA was enacted in place of NAFTA.
What to Watch
Monday, Sept. 18th
4:30PM – Retail Gas Price (Prior: $3.941/gal.)
Tuesday, Sept. 19th
8:30AM – Housing Starts (Prior: 3.86%)
10:00AM – Job Openings: Total Nonfarm (Prior: 8.827M)
Wednesday, Sept. 20th
2:30PM – Target Federal Funds Rate (Prior: 5.25-5.50)
Thursday, Sept. 21st
8:30AM – Initial Claims for Unemployment (Prior: 220k)
Sources: Index Returns: Morningstar Workstation. Past performance is no guarantee of future results. Indices are unmanaged and cannot be invested into directly. Three, five- and 10- yearreturns are annualized excluding dividends.Interest Rates: Federal Reserve, Mortgage Bankers Association.
MARKET HEAT MAP
The health of the U.S. economy is a key driver of long-term returns in the stock market. Below, we grade key economic conditions that we believe are of particular importance to investors.
The “Heat Map” is a subjective analysis based upon metrics that VNFA’s investment committee believes are important to financial markets and the economy. The “Heat Map” is designed for informational purposes only and is not intended for use as a basis for investment decisions.
Last week the Positive economic reports outweighed the Negative. Here are the Positives:
Job growth in May was well above expected at 280k (estimate of 226k); prior two months saw a combined upward revision of 32k. Unemployment ticked up one tenth to 5.5% because of a 397k increase in the labor force relative to the household survey gain of 272k. Participation rate was up one tenth to 62.9%.
Wages rose by .3% month over month and 2.3% year over year. That year over year gain matches the most since 2009. The payroll 6 month average is 236k vs the 260k average in 2014 as the May gain made up from only modest job gains in January, March and April. US Initial jobless claims totaled 276k, 2k less than expected but last week was revised up by 2k to 284k.
Autodata said 17.79mm cars & trucks were sold on a SAAR basis in May, well more than expectations of 17.3mm. It’s the best pace since 2005.
The Institute of Supply Management (ISM) manufacturing index for May rose to 52.8 from 51.5, above estimates of 52.0. It is off the lowest level since May ‘13. ISM said, “Comments from the panel carry a positive tone in terms of an improving economy, increasing demand, and improving flow of goods through the West Coast ports.”
Post-port strike, April trade deficit was $40.9b, about $3b narrower than expected. Exports rose for a 2nd straight month after 4 months of declines. Imports fell by 3.3% after a sharp 6.5% rise in March which followed port strike related declines in January and February. This will lift Q2 Gross Domestic Product estimates by a few tenths all else equal.
Personal Consumption Expenditures inflation figure for April was flat and up just .1% at the core rate, both one tenth less than expected. The year over year gain for the headline number was up .1% and up 1.2% at the core rate.
Personal income rose .4% month over month in April, one tenth more than expected. Private sector wage and salaries were up by .2% month over month and a pretty good 4.6% year over year.
Eurozone services Purchasing Managers Institute for May was 53.8, better than the initial print of 53.3 but down from 54.1 in April and vs 54.2 in March. Unemployment rate in April for the region fell to 11.1%, a level last seen in March ’12.
The final look at Eurozone May manufacturing Purchasing Manager Institute was 52.2 vs 52 in April and 52.2 in March and matches the best since May.
The European Markit Retail Purchasing Manager Institute rose back above 50 for the first time since June 2014 at 51.4 vs 49.5 in April.
Here are the Negative economic reports last week:
May Institute of Supply Manager services index fell to 55.7 from 57.8. It’s below the estimate of 57 and is at the lowest level since April 2014.
Mortgage Bankers Association said refi applications fell 11.5% week over week to the lowest level in 5 months as the recent uptick in mortgage rates has had an immediate impact on the desire to refi. Refi’s are now down 1.2% year over year. Mortgage applications to buy a home fell 3% week over week to the lowest since late March but are still up 14.5% year over year.
Global bond bubble has some more air come out in a messy week. Investors are saying no mas to taking an enormous amount of capital risk for very little reward in fixed income as central bank interest rate suppression has reached its limit. The US Treasury market in particular is calling out the Fed. Are they listening?
Personal spending in April was flat month over month, two tenths light vs expectations.
April factory orders report saw Core capital spending (non defense capital goods ex aircraft) revised down to a drop of .3% vs the initial print of up 1%. The year over year drop is now 2.6% vs down .6% first reported.
Q1 productivity was revised down to an annualized decline of 3.1% from -1.9% and with this, unit labor costs rose 6.7% from 5% initially reported for Q1. On a year over year basis, productivity in Q1 was up just .3%.
Are you not feeling the economic recovery? This could be why.
The following is based upon the writings of Barry Ritholtz, a well-known economic analyst:
“The future is already here — it’s just not evenly distributed.”
– William Gibson
William Gibson’s observation about the future was a reference to the idea that people have different access to new technology based on wealth and location. That visionary quote kept coming to mind as I have been traveling around the United States to meet with clients this past year. My itinerary gave me a good perspective on the U.S. economic recovery.
Like the future, it, too, is not evenly distributed.
Why is that? The economy is, in a word, “lumpy.” It is strong in some regions, anemic in others. Strength by economic sector varies widely. There are myriad reasons for this: Some parts of the country were much harder hit by the real estate collapse; some sectors naturally rebound more quickly; some innovations lend themselves to more rapid growth.
The kind of recovery that you personally are experiencing is highly dependent upon many factors, but today I want to focus on three: education, market sector and geography. The data suggest these elements matter a great deal. Look closely, and you can see how your personal economic recovery is doing — and why.
Let’s take a closer look at what matters most:
Education: If there is a single lesson you need to learn from this crash and recovery, it is that education matters a lot. The data from the Bureau of Labor Statistics makes clear the direct correlation between increased education and lower unemployment rates and higher wages.
We have a full year’s worth of data for 2014. Across all workers (over age 25 and working full time), the unemployment rate was 5 percent. For workers who had a high school degree or some college, the unemployment rate was a little higher than average (6 percent); with an associate’s degree, it was a little lower (4.5 percent). Schooling is where we really see a difference: Workers without a high school diploma had an unemployment rate of last year of 9 percent, double the average of workers with an associate’s degree.
Have a bachelor’s degree? Great, your peer group had an unemployment rate of only 3.5 percent. Master’s degree holders saw that fall to 2.8 percent, while doctoral graduates were at only 2.1 percent unemployment. Professional degree holders’ unemployment rate was the lowest at 1.9 percent.
Anyone who believes school doesn’t matter should recognize that enormous unemployment range of 1.9 to 9.0 percent.
If that does not convince, then look at compensation. Weekly wages are very similar in their distribution to unemployment: the average was $839 per week for all workers, but only $488 for those without a high school diploma. Those who held a professional degree averaged more than triple that amount at $1,639 per week. Bachelor’s degree holders averaged more than double at $1,101 per week.
Geographic location/market sector: I’m conflating these two together because in my experience they’re so closely related.
Since I have not visited every city in the United States, this is a somewhat anecdotal analysis. My experiences are not the same as a true data read. Even so, it is clear that some areas in the country are doing much better than others and give you a leg up in experiencing a robust recovery. Here is my short Top 5 list:
New York: Following a huge collapse, there is nothing like a trillion-dollar bailout to jump-start your economic recovery. In the face of an AWOL Congress whose fiscal stimulus was marginal by historical crisis standards, the Federal Reserve became the only game in town. Between TARP, ZIRP and QE, the Big Apple has been the recipient of much taxpayer largesse. Even Fed money that was destined for the rest of the country still passed through NYC. That worked to the advantage of the owner of the corner deli and the Porsche dealer alike.
The actions of the Fed not only cushioned the blow from the collapse but set the stage for the next round of expansion. In particular, finance and real estate sectors have been on fire in New York. Note that this is a theme in every city experiencing a boom. There always seem to be at least two hot sectors: (1) real estate and (2) something else. One drives the other.
-Washington, D.C.: If finance is driving the New York economy, the “business of politics” is driving the District. From lawyers to lobbyists to government contractors, the city is swollen with activity. We see it reflected in the real estate prices in the surrounding communities. Washington may talk about shrinking government, but leaders have been expanding all of the related industries that feed into — or off of — the seat of U.S. power and money.
-Seattle: This could very well be the hottest, fastest growing city in North America right now. It’s much more than just Amazon and Boeing and Microsoft (now in the midst of a Satya Nadella-led turnaround). There is Costco Wholesale, Starbucks, Nordstrom, Nike, T-Mobile US, Micron Technology and Expedia. Intellectual capital abounds. What makes the place so vibrant is the huge number of new tech start-ups and expanding existing firms. One is reminded of how Silicon Valley was in the early 1990s. Despite rising real estate prices, it is a very civilized place to live, with great outdoor activities and beautiful scenery. Most important of all, there is an energy and enthusiasm and optimism among all of the people I met in town.
-San Francisco/Silicon Valley: Another full-on boomtown. Technology is running on all eight cylinders, or, perhaps more accurately, a fully charged Tesla PowerWall. Whereas the dot-com boom was frivolous and frothy, filled with pie-in-the-sky business models, this is more substantive and functional. Lots of wild ideas are still getting funded, but in this cycle, revenues count. The infrastructure built around software and semiconductors is much more mature than it was back in the 1990s. Apps, alternative energy, big data and relentless innovation are keeping the city and its even more important surrounding technology suburbs humming.
Of course there is some froth, as that is inherent to the venture investing process. On occasion, silly ideas get funded and good ideas see ludicrous valuations (and vice versa). Most technorati will admit — after you pour enough alcohol into them — that venture investing looks like a huge crapshoot. For each Uber there are still 100 Pets.coms. But so long as the community of engineers and programmers keeps finding new and disruptive ways to do things better, the economy here is going to keep growing.
-Boston: With about the same population as Seattle, Boston has quietly managed a very nice economic recovery. It may not be quite as booming as some of the others I’ve mentioned, but it is growing smartly. Boston has a foot in biotech, medicine and health care, finance, high-technology research and development, and education. About the only things that are not nicely inflated in this town are the New England Patriots’ footballs.
Of course, this is a very biased sample set: I visit cities where we have clients, and, by definition, wealth management clients tend to be fairly wealthy. Hence, my sample set of cities is likely to be doing better than a randomly selected group of metropolitan locales. Iowa, which also enjoys a diverse economy plus a huge agricultural footprint, also maintains a very low unemployment rate. Utah, Colorado and Minnesota have also been strong. So too has Texas, which is no longer as energy-centric as it once was. In the 1980s, a fall in oil prices was catastrophic; its diverse economic base is better able to weather a commodity crash these days.
That said, lots of other parts of the country have also been doing well. Warren Buffett’s home state of Nebraska boasts the lowest unemployment rate in the United States, at 2.6 percent. (It eclipsed North Dakota, which has seen a modest uptick in unemployment as crude oil prices were cut in half since last September). The state has a big agricultural sector and food processing, notably beef production. But the state is fairly diversified, including electrical machinery and manufacturing, telecommunications and information technology.
So if you can put it all together — if you have a good education, choose your field wisely and live in a thriving area — the economy’s looking pretty good to you right now. If not, well, my experience suggests that you should take a hard look at those factors.
The stock market soared Friday, in part, because of a “goldilocks” jobs report for April – not too cold, not too hot, just right. Given the downward revision to March’s report and slow GDP growth, employment looks set to be weaker in 2015 than it was last year, says Morningstar’s Bob Johnson.