By: Chief Investment Officer, William Henderson
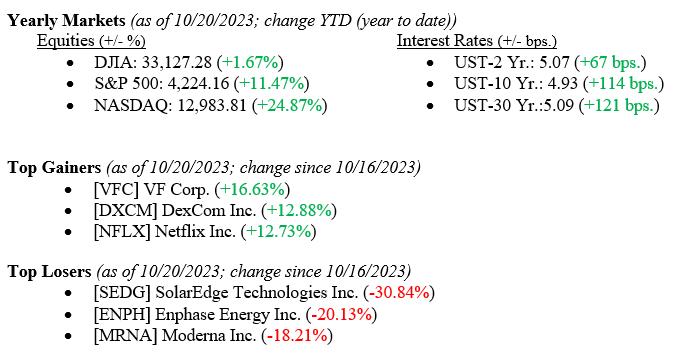
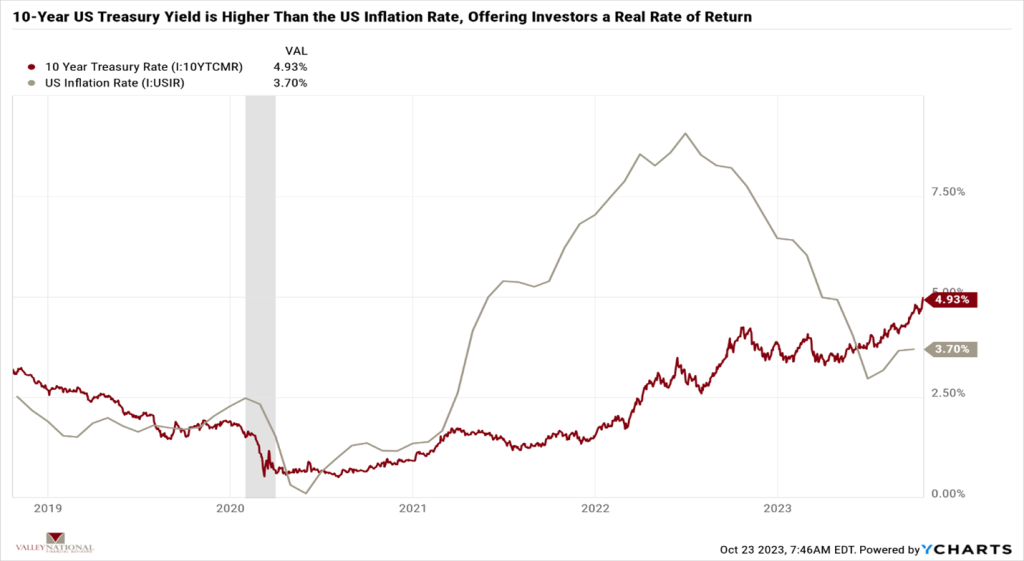
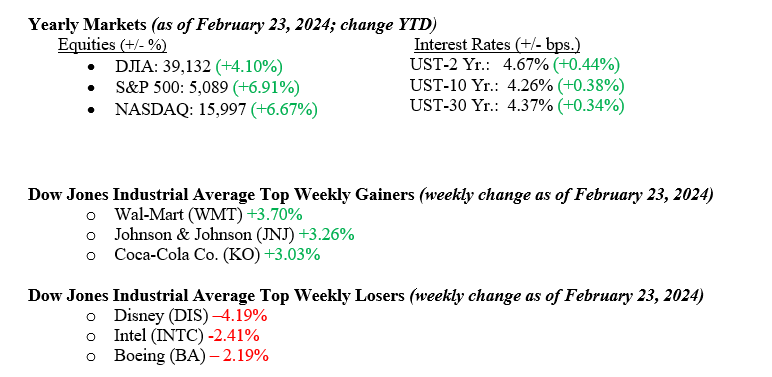
The shortened President’s Day Holiday week, with few economic news releases, allowed for one story to dominate the news and, therefore, market returns for the week. That story was AI (Artificial Intelligence) chip maker Nvidia’s (NVDA) 4th quarter EPS release, which showed the “Magnificent 7” member besting Wall Street analysts’ expectations for revenues and earnings. NVDA stock increased by +8.5%, adding $277 billion in market cap and notching a one-day Wall Street record. All major market indexes followed suit and ended the week higher: Dow Jones Industrial Average +0.9%, the S&P 500 Index +1.2%, and the NASDAQ +0.6%. An area of weakness in the stock market continues to be small capitalization stocks, which continue to lag the overall market. Fixed-income markets continue to push off any thoughts of rate cuts by the Federal Reserve before the second half of 2024. The 10-year U.S. Treasury bond yield fell four basis points to close the week at 4.26%.
U.S. Economy
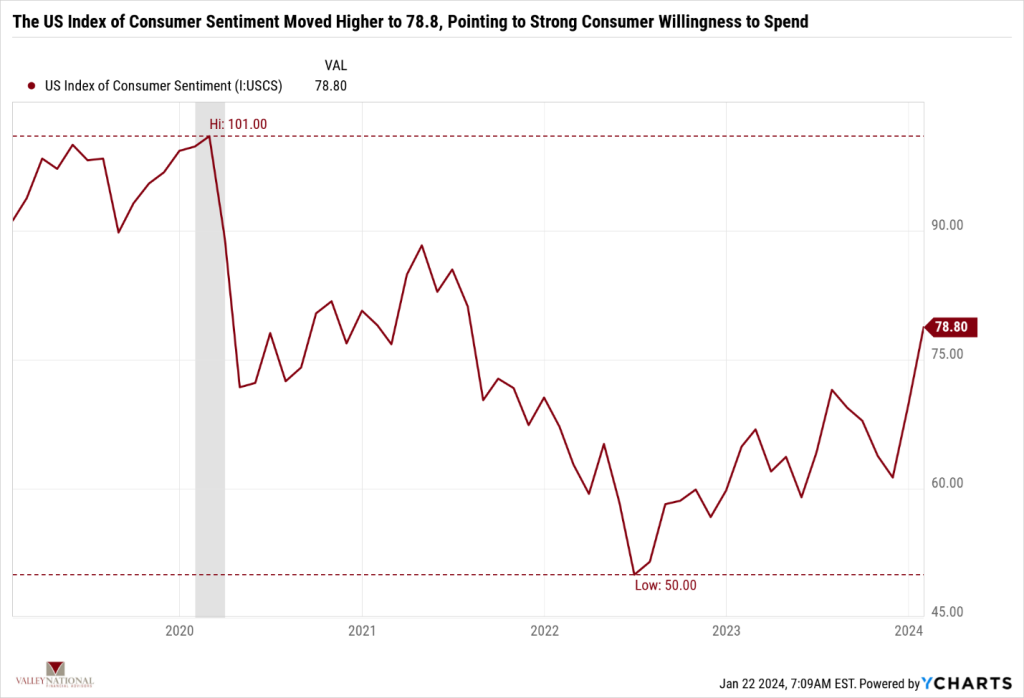
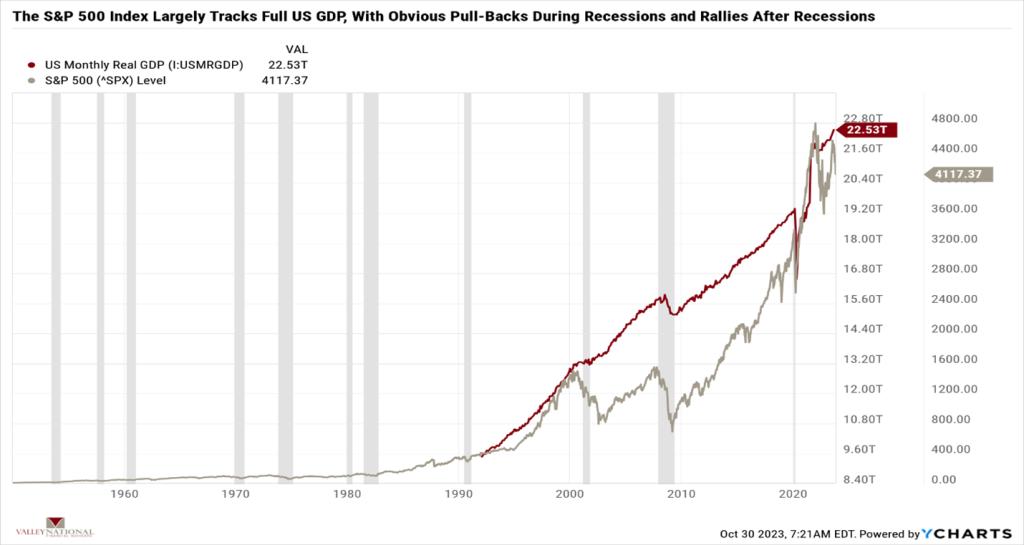
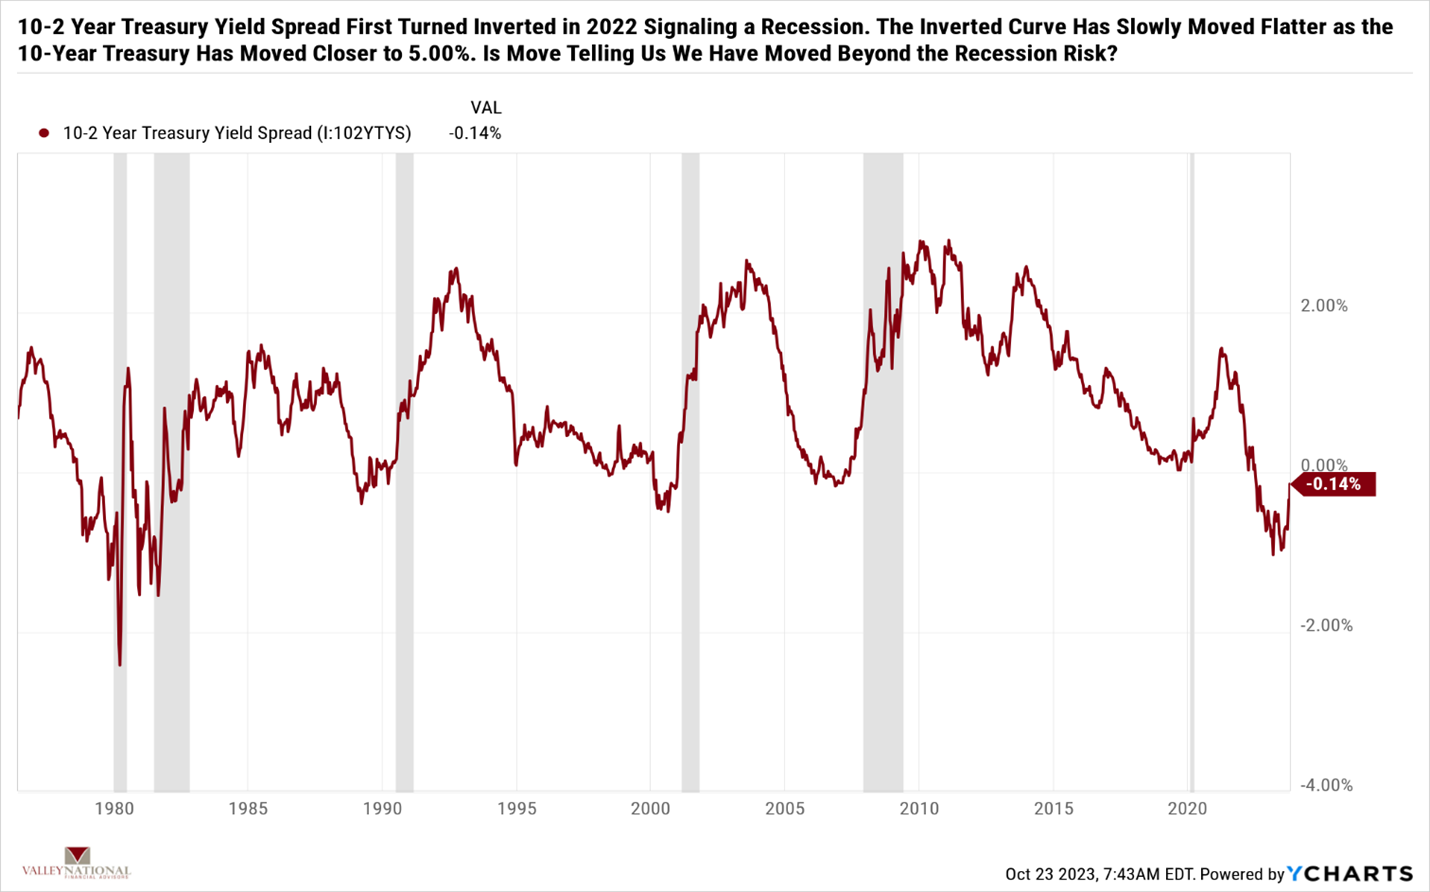
It was a quiet week for economic releases. This week, we get the revised 4th quarter US GDP (Gross Domestic Product), which will be closely watched for upward revisions from the current +3.3%. Further, the February 2024 Index for Consumer Sentiment will be released, and the question will be whether consumer confidence moves higher yet again. Minutes from the January 2024 FOMC (Federal Open Market Committee) meeting confirmed what we have been saying for quite some time, that interest rate policy will remain data-dependent. Policymakers further stated that they continue to see risks of continued price stability.
Policy and Politics
Of course, 2024 is a US presidential election year, and Saturday showed former President Trump beating former South Carolina Governor Nikki Haley in the South Carolina GOP primary. While the race for the GOP candidate is not over, it is getting narrowed down, but we will know who the GOP candidate is on Super Tuesday (March 5).
Globally, politics and policy remain troubled as there is no end in sight for either Ukraine/Russia or Israel/Hamas.
What to Watch This Week
- U.S. Real GDP (Quarter over Quarter) for Q4 2023, released 2/28/24, prior 3.30%
- U.S. Core PCE (Personal Consumption Expenditures) Price Index for January ‘24, released 2/29/24, prior 2.93%
- U.S. Initial Claims for Unemployment Insurance for week of Feb 24, 2024, released 2/29/24, prior 201,000.
- U.S. Index of Consumer Sentiment for Feb 2024, released 3/1/24, prior 79.60.
Anytime a single stock’s action moves the markets, such as Nvidia did last week, we realize how thin the markets are and how starved for news and events Wall Street traders are. Certainly, the NVDA news was big, and adding a $277 billion market cap was a new record, but shouldn’t the real story be the economy? The U.S. economy continues to confound all the experts as it grows and adds employees each week. After 90% of S&P 500 companies have reported 4th quarter earnings, we see a healthy 7.5% earnings growth. We will be intrigued this week as new 4th Q GDP data and the important measure of consumer confidence will be released. Market focus will soon move to the March FOMC meeting and whether there will be any change in monetary policy. Reach out to your advisor at Valley National Financial Advisors for help or questions.