Current Market Observations

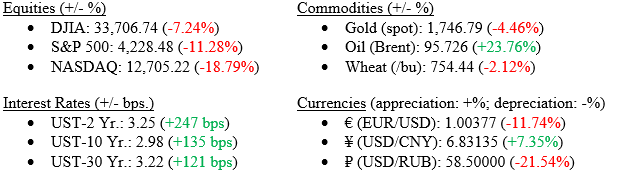
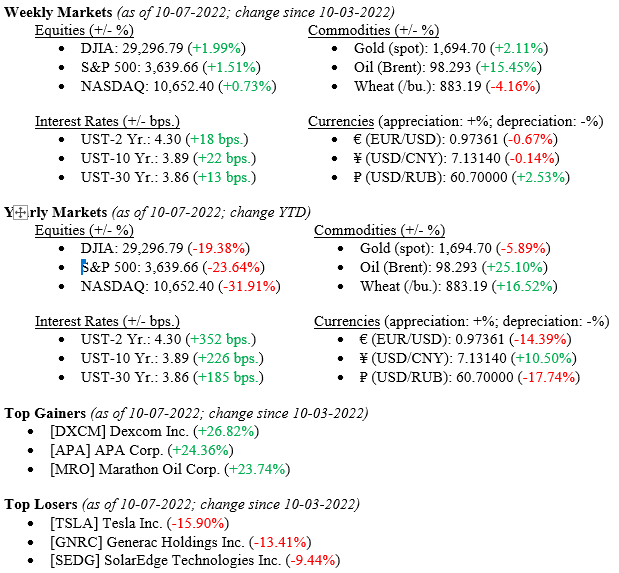
Equity markets posted their first weekly gain in several weeks as a surprise move by the Australian Central Bank to raise rates less than expected sparked a global rally in stocks. As the week progressed, hopes of an earlier “Fed Pivot” were dashed as little economic data released showed signs of a slowing economy or decreasing inflationary pressures. However, one small piece of economic data, Job Openings, released October 5 at 10.05 million vs. 11.17 million in the prior month showed a modest crack in the tight labor market.  

U.S. Economy 
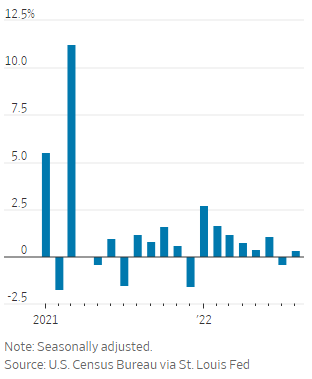
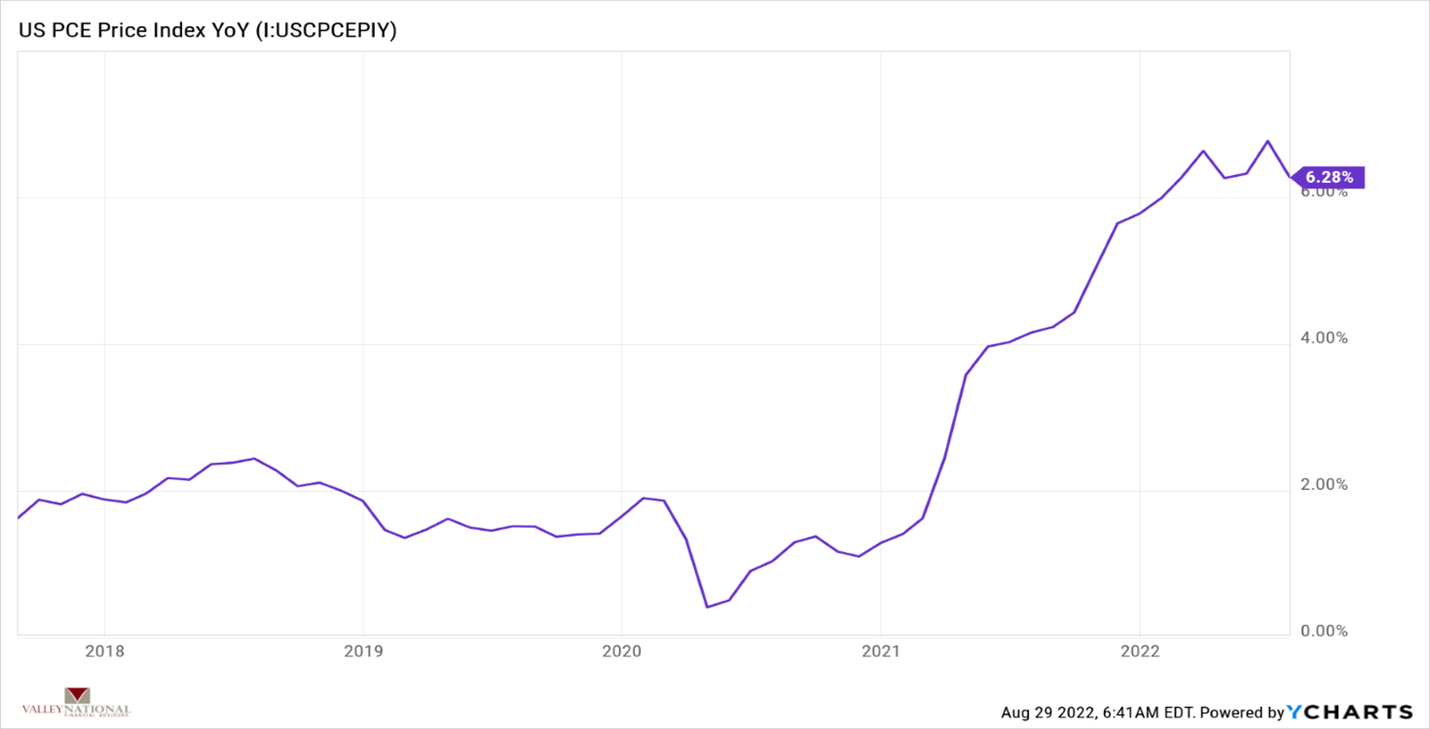
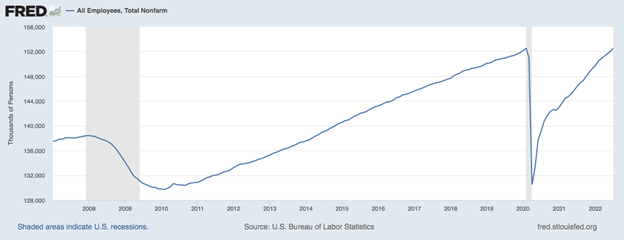
As mentioned, one piece of economic data from last week, U.S. Job Openings, which is a survey done to assess labor turnover, job openings, hires and separations, showed a decline from the prior month (-10%). Other labor data released last week including new jobs added (+263,000), unemployment (3.5%) and hourly earnings (+5%) all showed continued strength which means jobs data is strong enough to keep the Fed on track to hike interest rates +0.75% next month. The decrease in job openings shows that companies are slowing the pace of hiring before cutting jobs, therefore keeping the unemployment rate low. (See Chart 1 from Valley National Financial Advisors & Y Charts showing U.S. Job Openings and U.S. Unemployment Rate). 

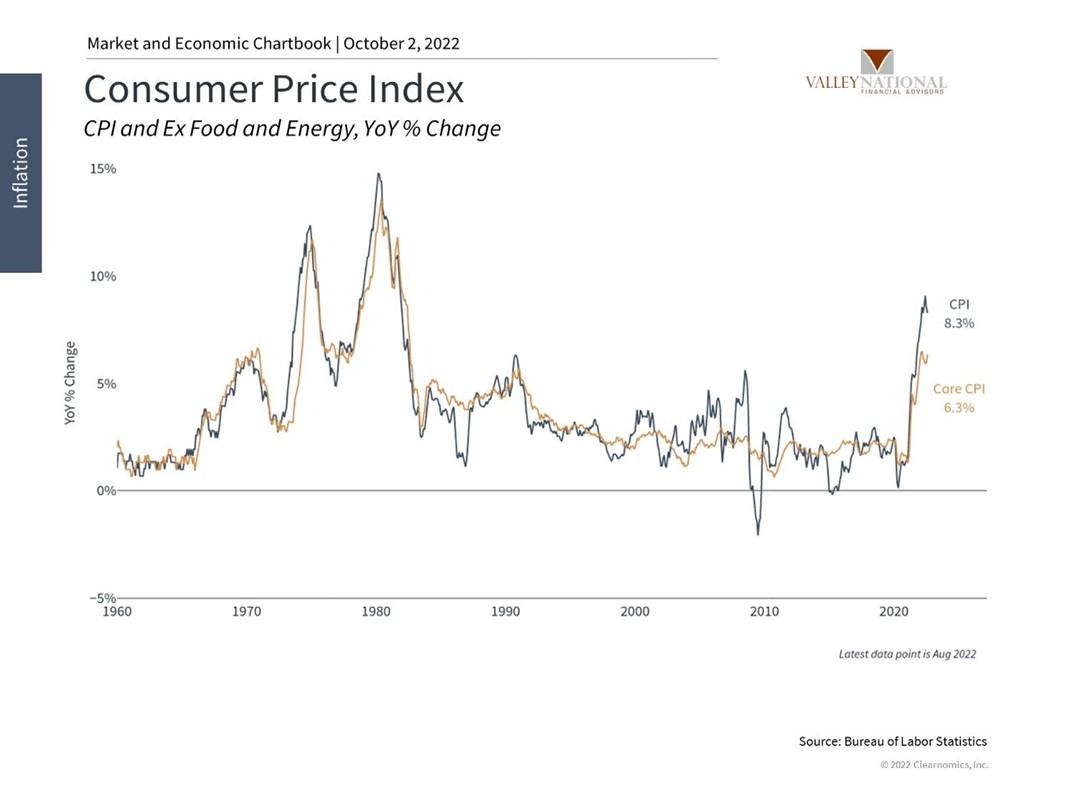
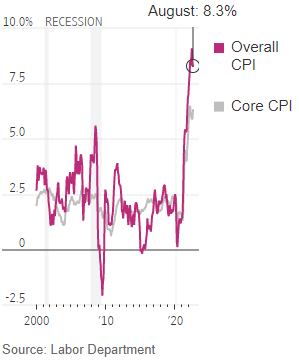
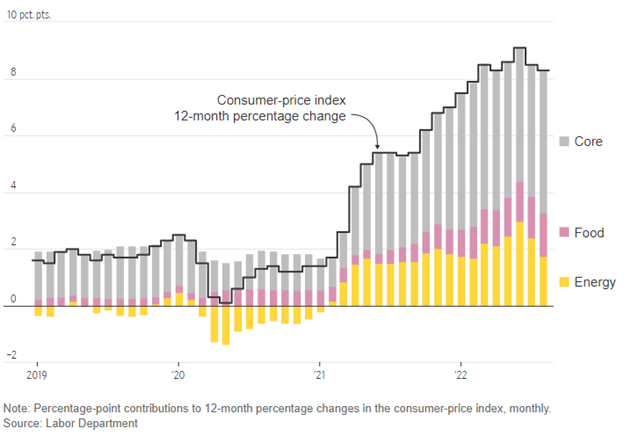
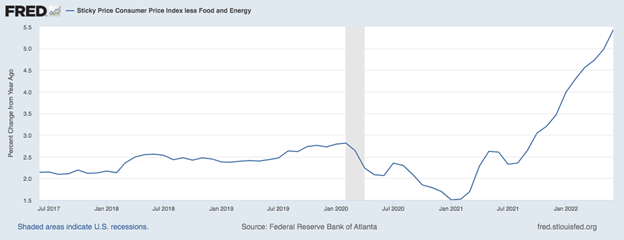
Last week’s labor trends were important, but this week’s inflation data is critically important because it will show whether the Fed’s aggressive interest rate tightening is having an impact on prices producers and consumers are paying. This is the critical data the Fed will be watching. Lastly, this week starts the third-quarter earnings season, which provides yet another reading of economic activity. 

Policy and Politics 
The Russia/Ukraine War is far from over. In fact, last week and this week we are seeing a drastic escalation in fighting with Vladmir Putin again casually mentioning nuclear weapons. We see this escalation as a severe threat to global stability and continued energy uncertainty and shortages for the Euro region. This opens the door (although unlikely to be used) for the U.S. to step up energy production via fracking, drilling or production and shipping of LNG (Liquefied Natural Gas) to Europe, for example. 

What to Watch 

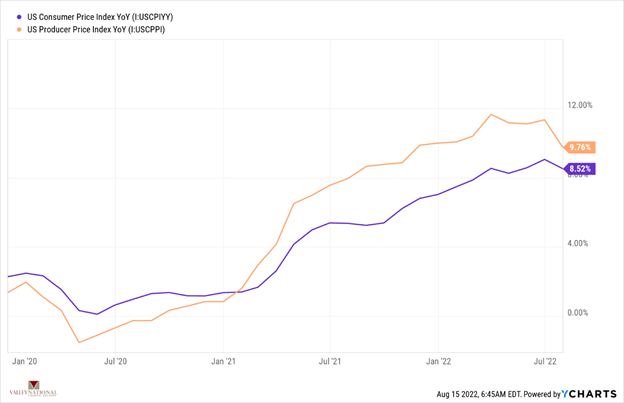
  • U.S. Core Producer Price Index year-over-year for September 2022, released 8:30am 10/12 (prior 7.26%) 
  • U.S. Producer Price Index year-over-year for September 2022, released 8:30am 10/12 (prior 8.72%) 
  • U.S. Consumer Price Index year-over-year for September 2022, released 8:30am 10/13 (prior 8.26%) 
  • U.S. Inflation Rate for September 2022, released 8:30am 10/13 (prior 8.26%) 

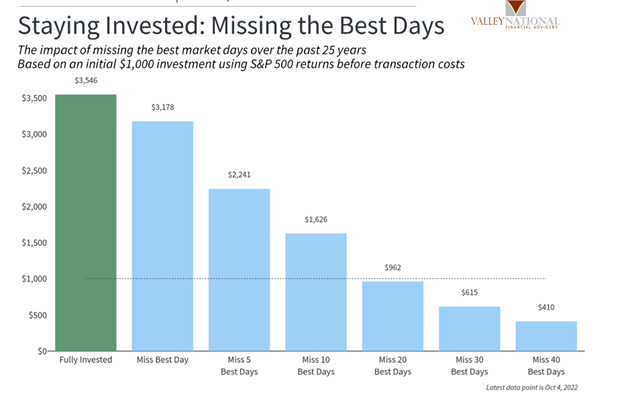
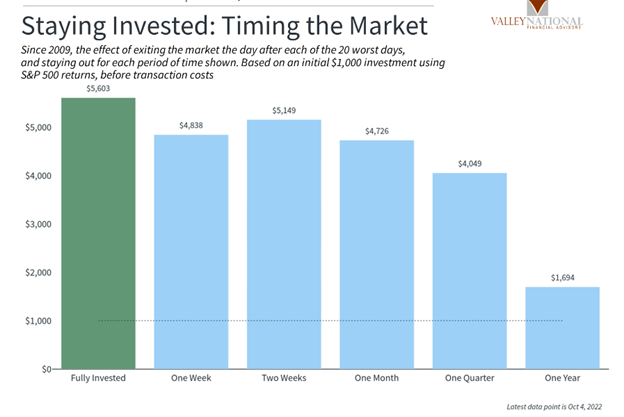
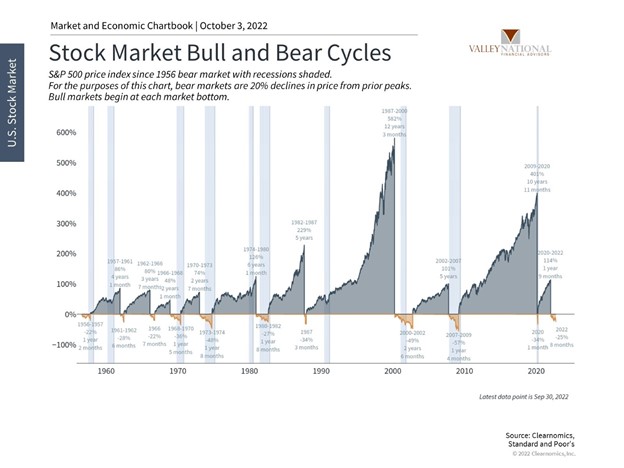
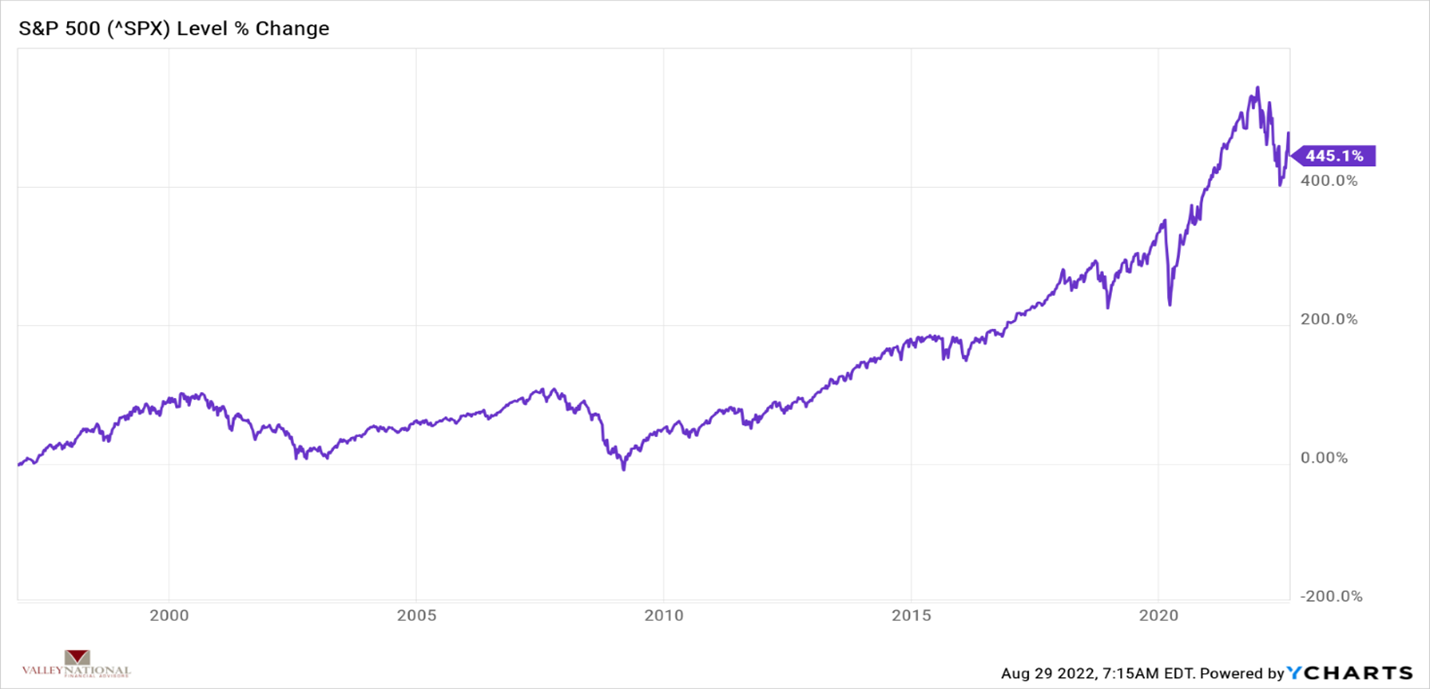
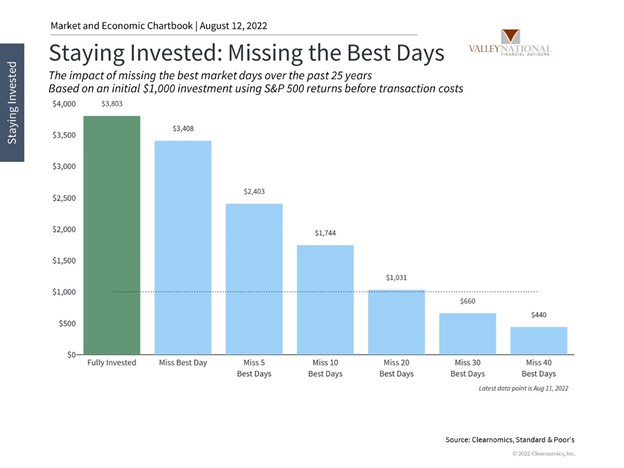
Last week we saw in just two trading sessions, the Dow Jones industrial Average gained over 5% (+1,328 points). An investor missing those two days by casually sitting on the sidelines rather than being invested, missed a major move in the markets which is why we always talk about “Time in the Markets” rather than “Timing the Markets.”  Real, transferable, and generational wealth is gathered over extended periods of time by patient and committed investors. We leave you with two classic charts from Valley National Financial Advisors and Y Charts: (Staying Invested: Missing the Best Days and Timing the Market).  

Current Market Observations

While market volatility was more modest than the previous two weeks, major U.S. stock indexes fell nearly 3%, declining for the sixth time in the past seven weeks. Further, the Dow Jones Industrial Average on Monday joined the S&P 500 and the NASDAQ in bear market territory, as the Dow declined more than 20% from its level of early January. In contrast, U.S. bonds rallied as the yield on the 10-Year U.S. Treasury fell five basis points during the week to close at 3.83% and well off its recent high of 3.95%. Multiple concerns continue to plague markets including lingering inflation, Russia/Ukraine war, impacts of Hurricane Ian in Florida and greater chances of a modest recession. 

Global Economy 
Global inflation certainly is the major issue impacting markets and until we see tangible results of the FED’s interest rate tightening policy on inflation, the market will remain volatile and data dependent from week to week. Massive cash creation at the Federal level, global supply chain issues and pent-up demand as a result of COVID-lockdowns, created inflation in the form of increased prices for goods and services. Inflation got us here; deflation is the cure. 

Thankfully, we are starting to see “behind the scenes” deflationary signals. Major commodities, such as lumber, are down in price to pre-pandemic levels, Trans-Pacific shipping rates are down 75% from a year ago, and Oil (as measured by WTI) is down to $83/bbl. from $123/bbl. in March of this year. (See Chart 1 from Valley National Financial Advisors & Clearnomics showing CPI.) As lower prices work their way through the supply chain to producers, prices offered to consumers should decline as well and the FED will start to see tangible results from their inflation combat efforts. 

Policy and Politics 
The newly elected Prime Minister Truss of the U.K. was forced to do a U-turn on her recently announced plan to scrap the 45% tax rate. The humiliating retracement was due to outrage by Tory MPs at a tax-cut during a time of energy shortages, high prices and market uncertainty.   

Russia annexed portions of Ukraine while Vladmir Putin vowed to use all means necessary to assure victory in the war. Meanwhile, Russian forces withdrew from the eastern Ukrainian port city of Lyman, in an obvious defeat. There seems little end to this conflict. Instead, further escalations by both sides does not bode well for Eurozone countries that rely on energy supplies from Russian and Ukraine.  

What to Watch 

  • U.S. Job Openings for August 2022, released 10/4/22 (prior month 11.24M) 
  • U.S. Initial Claims for Unemployment for Week of October 1, 2022, released 10/6/22 (prior 193k) 
  • U.S. 30-year Mortgage Rate for Week of October 6, 2022, released 10/6/22 (prior 6.7%) 
  • U.S. Unemployment Rate for September 2022, released 10/8/22 (prior 3.70%) 

While it seems a tall order to recommend investors “stay the course” or “remain committed” but that remains our recommendation as we advise that true wealth creation happens over long periods of time. Certainly, while being down double-digits across all markets and over nine long months is painful, it is time to steel one’s resolve and stay invested. This tenet is even more relevant when the very definition of a risk-free investment, three-month U.S. Treasuries, are paying 3.23%, and enticing investors to flee the markets rather than stay invested. Bull Markets are always punctuated by Bear Markets and Bear Markets last, on average, 14 months, while Bull Markets last, on average, five years or more (See Chart 2 from Valley National Financial Advisors & Clearnomics showing Stock Market Cycles 1960-current).   

Current Market Observations

Market volatility continued last week as uncertainty around the Federal Reserve weighed heavily on investors. As was widely expected, the Fed raised interest rates by 75bps, bringing its target rate to 3.00-3.25%, while also adding language suggesting that further rate hikes are likely. As we implied last week, market movements are becoming increasingly tied to Fed decisions. However, it is important to remember that the Fed is only able to influence the relative movements in markets that are short-term, while long-term investors can capitalize on these down markets. Just to reiterate our point: this is an opportunity for wealth creation, not something to be afraid of as a long-term individual investor.

Global Economy
The Federal Reserve raised rates by 75 basis points on Wednesday, its third consecutive 0.75% rate hike this year. However, rate hikes are persistent across the globe to combat inflation, which is ringing in at 9.2% annually within the G20 countries. It is important to remember that inflation is not caused solely by policy within any given country due to increased globalization. Chart 1 below shows central banks’ rate paths over the prior three years. The Federal Reserve has indicated that it will raise rates by 1.00% to 1.25% over its next two meetings.

The U.S. housing market fell for the seventh straight month in August as mortgage rates hit new averages above 6% for the first time since 2008. Thirty-year mortgage rates a year ago were 2.86%. Sales of previously owned homes fell 0.4% in August to a rate of 4.8 million. (See Chart 2 below) Year-over-year, sales fell 19.9%. Home sales data tends to be lagged due to the length of the home-buying process — meaning that home purchases in August really reflect mortgage approvals from earlier in the summer when rates were modestly lower. We will not see the effects of these new highs in mortgage rates until closer to the end of the year.

What to Watch

  • Avg. U.S. Retail Gas Price figures to be released Monday, Sept. 26th at 4:30 PM EST.
  • Case-Shiller Home Price Index data to be released Tuesday, Sept. 27th at 9:00 AM EST.
  • U.S. Crude Oil Stocks week-over-week figures to be released Wednesday, Sept. 28th at 10:30 AM EST.
  • 30-Year Mortgage Rate data to be released Thursday, Sept. 29th at 10:00 AM EST.
  • U.S. Core PCE (Personal Consumption Expenditures) Price Index month-over-month figures to be released Friday, Sept. 30th at 8:30 AM EST.

Current Market Observations

Equity markets logged a poor week of returns mainly due to inflation data surprising slightly to the upside. This was an emotional reaction to counteract widespread optimism.“It’s not timing the markets, it’s time in the markets” is an adage that continues to hold true despite recent volatility and noise. This is when long-term investors with a goal of wealth creation endure. 

Global Economy 
Last week, U.S. inflation came in at an annualized 8.3% versus 8.1% expected. To curb inflation, central banks worldwide have been raising interest rates, with the Federal Reserve expected to raise by 0.75% later this week. Despite good intentions, the World Bank is warning of a potential global recession if rates rise too high, claiming that synchronous tightening could compound effects as each country implements aggressive monetary policy. Please see Chart 1 for historical Core and Overall CPI inflation data, and Chart 2 for contributions to inflation. 

Chart 1: Consumer-price index, change from a year earlier. 

Chart 2: Contributions to inflation 

U.S. Retail Sales rose 0.3% in August, which marks a reversal from July’s print of -0.4%. This reversal is likely driven by decreases in gas prices across the country. Remember that gas and oil are inputs for basically every good you can possibly purchase. As prices come down, costs to produce and transport goods do as well, not to mention consumers having more disposable income based on what they save at the pump. For historical month-over-month retail sales data, please see Chart 3.  

Chart 3: Month-over-month change in retail sales 

What to Watch 

  • U.S. Retail Gas Price on Sept. 19th at 4:30 PM EST. 
  • U.S. Housing Starts and U.S. Housing Starts Month over Month on Sept. 20th at 8:30 AM EST. 
  • U.S. Existing Home Sales and US Existing Home Sales Month over Month on Sept. 21st at 10:00 AM EST. 
  • Target Fed Funds Rate on Sept. 21st at 2:15 PM EST. 
  • U.S. Initial Claims for Unemployment on Sept. 22nd at 8:30 AM EST. 
  • 30-Year Mortgage Rate on Sept. 22nd at 10:00 AM EST. 

Summary 
Although inflation was higher than expected, it’s important to remember that last week’s print still shows signs of improvement over the prior month. Additionally, global concerns continue to dominate the news, such as Russia/Ukraine, Chinese quarantined cities, and the energy crisis in Europe. While there are concerns of a global recession, the United States still exhibits a strong labor market and healthy consumer financials which should help maximize economic rebound potential through the end of the year. 

Current Market Observations

The equity markets recovered nicely last week with gains of +1.6% (Dow Jones) to +2.8% (NASDAQ) while the bond market remained quiet, trading in a tight range with the 10-Year U.S. Treasury remaining unchanged to close the week at 3.33%. There were three key themes last week positively impacting the markets: 1) Traders and economists are starting to agree that we are approaching the end of the Fed’s interest rate tightening cycle, 2) Global disinflation 3) Earnings estimates are holding steady rather than declining.  

Global Economy 
As mentioned above, we are finally starting to see some disinflationary indicators. See Chart 1 from Valley National Financial Advisors and Y Charts showing the U.S. Inflation Rate (year-over-year) and U.S. Core Consumer Price Index (year-over-year). After both rates peaked at recent record levels, we have seen these indicators coming down and these are two key rates the Fed looks at when considering future interest rate moves. Reminder – the FOMC (Federal Open Markets Committee) meets September 20-21, and they are widely expected to raise rates another 0.75%, to a target rate of 3.25%. We believe the terminal rate for Fed Funds Rate is 3.50% – 4.00%. 

Further, yields on the 10-Year US Treasury have stabilized and, in fact, now offer investors a reasonable rate of return at 3.33%. The 10-Year US Treasury rate in June peaked at 3.48% and has since fallen, however the 10s – 2s yield curve remains negative as fixed income investors worry about a recession (See Chart 2 below from Valley National Financial Advisors and Y Charts).  

Policy and Politics 
While the Russia / Ukraine war ravages on, Ukraine is making major moves to push back Russian advances and the media is pushing a “Ukrainian Victory” narrative. This would be a stunning upset and a global black eye for Russian President Vladmir Putin. What concerns us is Putin’s reaction from here: whether retaliatory in terms of further energy cut offs to Europe or drastic military actions. Either way, this issue remains an unknown and a concern. 

The U.S. labor market remains resilient and extremely healthy. In August, non-farm payrolls increased by more than expected and the unemployment rate decreased to 3.5%. Further, there continues to be broad based job gains across all sectors, which supports the premise that the U.S. economy is holding up well despite tightening financial conditions brought on by the monetary policy of the Fed. 

What to Watch 

  • U.S. Inflation Rate for August 2022 released at 8:30am on 9/13/22 (prior 8.52%) 
  • U.S. Core Consumer Price Index for August 2022 released at 8:30am on 9/13/22 (prior 5.91%) 
  • U.S. Producer Price Index for August 2022 released 8:30am on 9/14/22 (prior 9.76%) 
  • U.S. Initial Claims for Unemployment Ins. for week of Sept 10, 2022, released 8:30am 9/15/22 

Summary 
While inflation is abating, global concerns exist in Europe with energy prices and shortages, the Russia / Ukraine war, and COVID-related lockdowns in China. The U.S. remains on a solid recovery path with companies successfully dealing with pricing issues and thereby continuing to show earnings growth, albeit at a more tepid pace. The strong labor market, healthy bank, and consumer balance sheets all look to power the U.S. economy to a rebound in economic activity though year-end 2022.

Current Market Observations

Financial markets spent the week anxiously anticipating Fed Chairman Jay Powell’s closing speech on Friday at the annual Jackson Hole Symposium. The market’s reaction (the Dow fell more than 1,000 points) reminded us of a previous Fed Chair’s comments regarding “irrational exuberance” in the markets and a similar reaction (more on that later). Chairman Powell noted that the Fed is going to remain vigilant on fighting inflation by continuing to raise short-term interest rates, even at the risk of significantly slowing the economy. For the week ended August 26, 2022, the Dow Jones Industrial Average fell -4.22%, the S&P 500 Index dropped -4.04% and rolling with the “four-handles,” the NASDAQ finished down -4.44%. Interest rates remained unchanged with the 10-Year U.S. Treasury Note rising only one basis point last week to close at 3.04%. 

Global Economy & Financial Markets 
As mentioned, Fed Chairman Powell emphasized at his speech last week that inflation remained their number one concern and further emphasized that employment and economic growth remain secondary to the inflation concern. That said, last week, we saw the Fed’s preferred inflation gauge, U.S. PCE (Personal Consumption Expenditures) Price Index fall to 6.28% for July 2022 v 6.80% in June 2022. (See Chart 1 from Valley National Financial Advisors and Y Charts). 

While inflation remains hot and well above the Fed’s 2.5% target rate, it shows that the aggressive monetary policy (raising short-term interest rates) is working, and inflation is slowly ebbing. 

On December 5, 1996, then Fed Chairman Alan Greenspan, referring to stock market prices violently rallying around the time of the “dot-com” bubble, stated that the markets may be exhibiting “irrational exuberance.” Markets around the world quickly sold off by -3-4% across all sectors. That market reaction of 1996 was repeated last week when Fed Chairman Powell stated quite succinctly that the Fed was going to keep raising interest rates to combat inflation. Interestingly to us, this should not have been unknown news, as inflation is still running hot. Even sticky inflation (less food & energy) is running above 5%. What is important to remember from 1996 and from last week is where the markets have come since Greenspan’s comments. (See Chart 2 below from Valley National Financial Advisors and Y Charts).  

Certainly, it is sometimes difficult to think long-term when markets violently sell off -4.00% as they did last week, but the numbers do not lie. Whether it is Powell talking about higher interest rates or Greenspan scolding markets for “irrational exuberance,” markets move higher over time. In fact, since 12/5/1996, the S&P 500 Index is up a staggering 445%, and during that time we have also seen massive selloffs (think Great Recession, Pandemic), which occur normally and sometimes frequently in well-functioning markets. 

What to Watch 

  • Case-Shiller Composite 20 Home Price Index Year-over-Year for June 2022, released 9:00am 8/30/22 
  • U.S Initial Claims for Unemployment Insurance for week of August 27, released 8:30am 9/1/22 
  • U.S. Unemployment Rate for August 2022, released 8:30am 9/2/22 

Current Market Observations

Equity markets were on their way to a fifth consecutive week of gains until last Friday when new concerns about additional rate hikes and a weakening housing market weighed on stocks to push the week into the red by the end of trading. For the week ended August 19, 2022, the Dow Jones Industrial Average fell a nominal -0.16%, S&P 500 Index dropped -1.21% and the NASDAQ finished the week down -2.62%. The poor market news weighed heavily on the bond market as well as the 10-Year Treasury Note closed last week at 2.98% higher by +0.14% since last week, but still lower than the June 2022 recent high of 3.48%.

Markets (as of 8/19/2022; change YTD)

Global Economy
As mentioned above, investors and economists will now spend all week parsing and analyzing comments by various Fed speakers this week at the Fed’s annual three-day meeting in Jackson Hole, WY. The meeting will give the Fed the chance to reset or at least clear up thoughts about the pace and duration of future rate hikes. Markets are pointing to a “hawkish” (tighter monetary policy) Fed tone relayed by speakers. A “dovish” (less aggressive moves in interest rates) pivot by the Fed would be considered a positive move for the markets.

One point to consider when thinking about a key economic indicator of the U.S. Economy is the housing market, which continues to slow. Higher mortgage rates are impacting the housing market. Existing Home Sales have fallen for the last six months. (See Chart 1 below from the Federal Reserve Bank of St. Louis of Existing Home Sales). According to the most recent 2019 “Survey of Consumer Finances,” the primary residence continued to be the largest asset on the balance sheets of households. While most housing experts agree that we still face a housing shortage, higher mortgage rates and slowing sales are concerning.

While higher interest rates and a modestly cooling housing market weigh on the markets and the economy, it is important to remember that the consumer makes up the vast majority of economic activity and consumer spending and activity continues to be strong. The July 2022, retail sales numbers, while flat, were mostly impacted by lower gasoline prices. (See Chart 2 below from the Federal Reserve Bank of St. Louis showing Retail Sales).

Lastly, a look at employment and the labor market is important. Weekly claims for unemployment last week came in at 250,000 new claims. In the big picture, a weekly jobless claims number of “only” 250,000 new claims is still well below long-term historical averages but also above lows seen as recently as March of 2022. (See Chart 3 below from Valley National Financial Advisors and YCharts). While there seems to be some modest slowing or cooling off in the labor market, unemployment remains at a 50-year low (3.5%) and job openings remain high, and consumer finances and balances sheets remain healthy by any historical measure.

What to Watch

  • Fed Chairman and other market expert’s comments during the annual Jackson Hole, WY symposium taking place this week.
  • U.S. Durable Goods New Orders for July 2022, released on August 24, 2022
  • U.S. Real GDP Quarter over Quarter (revised for 2nd quarter 2022), released on August 25, 2022

Current Market Observations

Financial markets finally got what we have all been waiting for: a hint that the Fed’s aggressive monetary tightening policy is putting a cap on the economy’s hot running inflation problem. Last week, we saw U.S. CPI (Consumer Price Index) and U.S.PPI (Producer Price Index) fall for the month of July. The markets rallied strongly on the data, as they have been since the U.S. 10-Year Treasury Note hit 3.48% less than two months ago. The 10-Year Treasury Note closed last week at 2.84%, down 0.64 basis points since June 2022. The Dow Jones Industrial Average moved higher last week by +2.92%, the S&P 500 Index added +3.26% and the tech-heavy NASDAQ finished the week up a solid +3.08%. Last week’s move higher across all major sectors reminds us why what matters to long-term investors is “time in the markets” not “timing the markets.” 

Markets (as of Market Close, 8/12/2022; change YTD) 

Global Economy 
As mentioned above, last week’s economic releases finally showed that inflationary pressures are starting to abate. Both U.S. CPI and PPI showed a decline year-over-year, (see Chart 1 from Valley National Financial Advisors and YCharts). What was particularly encouraging from the data was that many critical components of inflation showed declines, including gasoline, select apparel and used cars. 

We still have work to do on the inflation front as shelter (home prices and rent) and labor costs continue to show strength and little signs of softening in prices. This tells us that the Fed will not signal a pivot (from tightening monetary policy to softening) just yet but will remain data dependent. However, markets are always more efficient than we give them credit for, and we continue to see solid performance in the markets. As mentioned above, since the U.S. Treasury Note hit its 2022 high on June 15, all major markets, including the bond market have rallied solidly. (See Chart 2 from Valley National Financial Advisors and YCharts, showing how each index has performed since June 15, 2022.) Of particular note is the NASDAQ composite which is up +20.5% during the period mentioned. 

We are not market timers at Valley National Financial Advisors. Instead, we believe that consistent, thoughtful long-term investing is the key to wealth creation. Missing big market weeks like last week can wipe out gains and set investors back years. Chart 3 below from Valley National Financial Advisors and Clearnomics shows the impact of missing the best days of the market rather than simply staying invested. 

Policy and Politics
While the U.S. and other developed countries are tightening monetary policy to combat inflation, China is perversely doing just the opposite. China’s Central Bank cut two of its key interest rates by 10 basis points Monday based on weak lending data released last week. Oddly, at the same time, the government is still pursuing strict COVID-zero lockdown in several provinces, which holds back any real hope for consumer-led acceleration in the world’s second-largest economy. 

What to Watch 

  • Continued weakness in Oil. Watch WTI (West Texas Intermediate) prices this week, currently at $87.18/barrel, down from its March 8, 2022, high of $123.70/barrel. 
  • A lens into to the current health of the U.S. Consumer with 2ndQ ‘22 EPS (Earnings Per Share) releases out this week from Lowes, Home Depot, Target, and Wal-Mart. 
  • U.S. Claims for Unemployment and 30-Year Mortgage Rate, both released on August 18, 2022. 

Current Market Observations

Major equity markets finished mixed last week with the Dow Jones Industrial Average falling by a modest -0.13%, the S&P 500 Index increasing +0.36% and the NASDAQ finishing the week up a healthy +2.15%. Markets were compelled higher on an extraordinarily strong July 2022 new jobs numbers +528,000 and a near record low unemployment level of 3.5%. This new employment data means the economy has gained back all the jobs lost since the COVID-19 pandemic began in March of 2020.  

Markets (as of EOD 08/05/2022; change YTD) 

Global Economy 
U.S. Treasury bonds sold off last week on Friday’s stronger-than-expected jobs report. Investors sold bonds on the news and the yield of the 10-Year U.S. Treasury bond increased to 2.83% from 2.67% last week. What is more important to watch is the continued steeply inverted yield curve (Chart 1) we are witnessing with the 2-Year U.S. Treasury yielding 3.24% vs the 10-Year U.S. Treasury at 2.84%. We have mentioned it many times that inverted yield curves (when shorter-term bonds yield more than longer-term bonds) typically precede recessions. 

Since the curve first inverted earlier in 2022, we have since seen two quarters of negative GDP (Gross Domestic Product): 1Q -1.6% and 2Q -0.9%; which historically has defined a recession (Chart 2). 

Herein lies the conflicting data the Fed and economists need to deal with. We have massive new job growth (Chart 3) strong EPS (Earnings Per Share) and healthy U.S. banks, so it is difficult to admit we are in a recession. 

However, continued hot inflation data (Chart 4) is compelling the FOMC (Federal Open Markets Committee) to raise rates aggressively, which is slowing the economy, as shown in Chart 2 above. 

Our summary here is that the markets are telling us something different than the economic data. Since the 10-Year U.S. Treasury bond hit its recent high on June 14, 2022, of 3.48%, the S&P 500 Index is up 11%. Whether this signaled the end of the bear market or not is yet to be seen. However, the stock market has historically been the best predictor of future economic growth. We are giving credit to Chairman Powell and hoping that he can achieve a path to a soft landing from extremely high inflation to modest inflation (~2.5%) and solid employment (unemployment ~ 3.5%). 

What to Watch 

  • U.S. Retail Gas Price for the week of August 8, 2022, released at 4:30 p.m. on August 8th. 
  • U.S. Consumer Price Index, Year-over-Year for July 2022 released at 8:30 a.m. on August 10th 
  • U.S. Inflation Rate for July 2022 released at 8:30 a.m. on August 10th 
  • U.S. Producer Price Index, Year-over-Year for July 2022 released at 8:3 a.m. on August 11th 
  • 30-Year Mortgage Rate for the week of August 11, 2022, released at 10:00 a.m. on August 11th