Current Market Observations

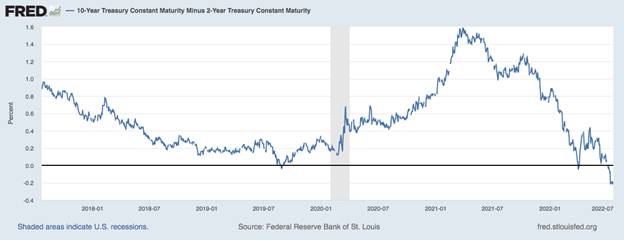
Last week, the markets were torn between the FED’s message on Wednesday, continued inflationary pressures and weak economic growth data, yet for all the uncertainty, Wall Street posted a positive week overall. For the week, the Dow Jones Industrial Average rose +3.0%, the S&P 500 Index increased by +4.3%, and the tech-heavy NASDAQ moved higher by +4.7%. Continuing its month-long rally, the 10-Year U.S. Treasury Bond fell another 10 basis points during the week, to close at 2.67%; quite an unusual feat considering that the FED is technically in a tightening (moving interest rates higher) cycle. The yield curve continued its inverted stance and GDP figures released last week confirmed that we saw two back-to-back quarters (albeit very modest dips) of negative GDP (economic growth).   

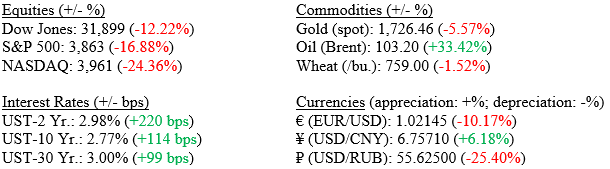
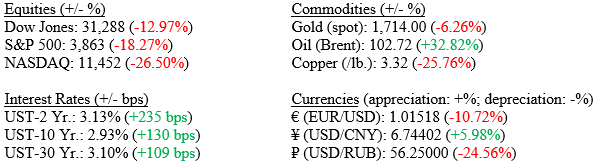
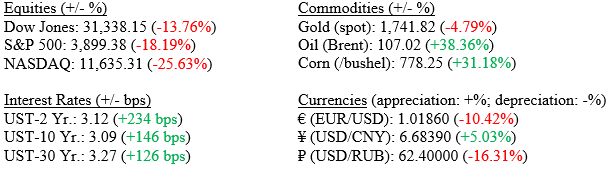
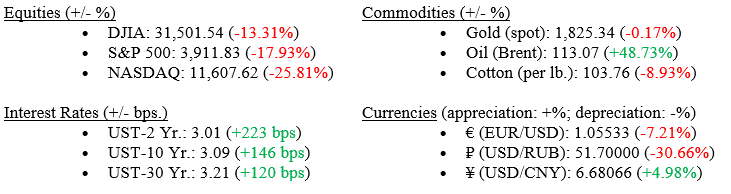
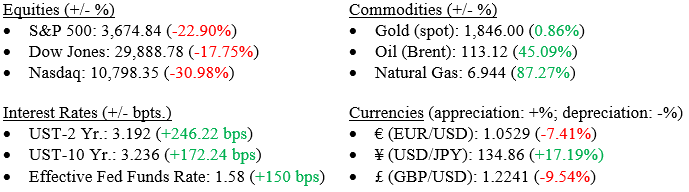
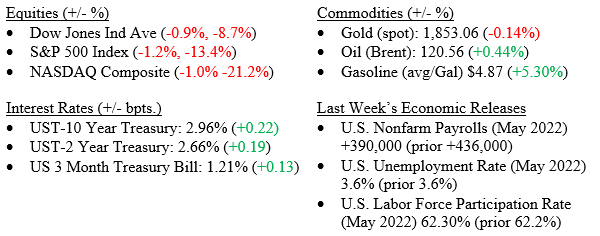
Markets (as of 7/29; change YTD) 

Global Economy 
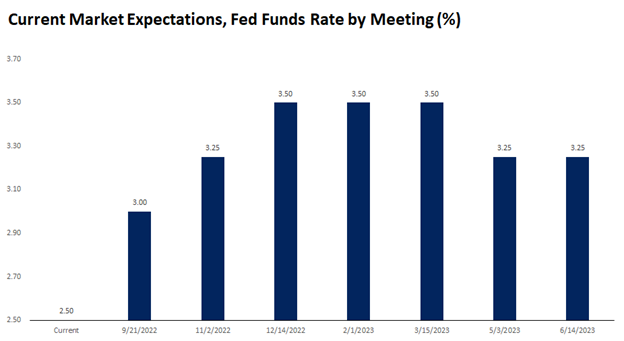
At last week’s FOMC meeting, the Federal Reserve raised rates by 75 basis points (0.75%), bringing the benchmark fed funds rate to 2.50%, the highest level since 2019. Fed Chair Jerome Powell noted in his commentary that the fed funds rate is now close to the Fed’s estimate of a neutral rate, indicating an official end of the post-pandemic easy money policy. Chairman Powell also noted that by the end of the year, fed funds could be at their terminal rate of 3.00% to 3.50%. There may only be one or two more rate hikes this year thereby slowing or ending this tightening cycle. Chart 1 below from FactSet shows the current market expectations by Fed meeting date. Importantly, as early as March 2023, we could see rate cuts as the Fed begins to deal with slowing economy.

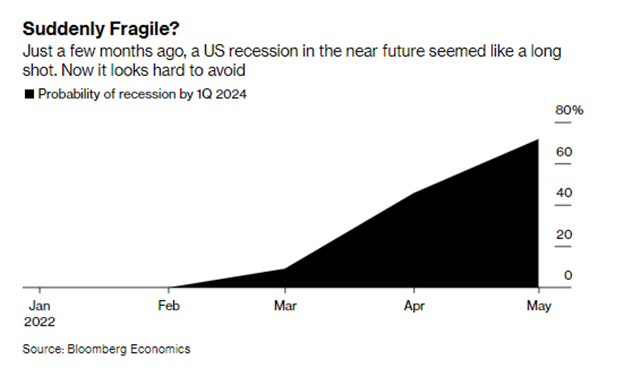
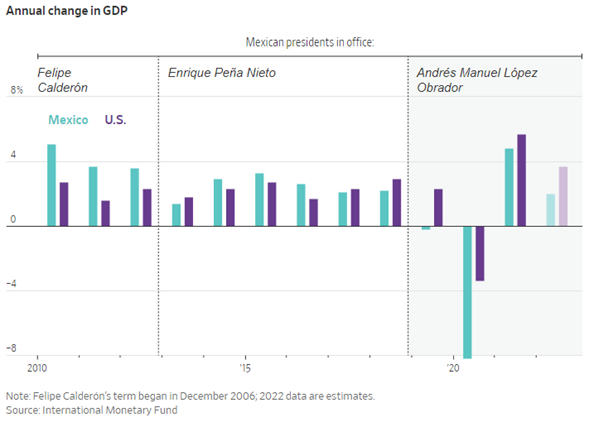
As noted above, the markets ended the week, and the month, with strong gains. Clearly, the markets are banking on a Fed pivot (moving from tightening or raising rates, to easing or lowering rates). GDP figures released last week for the second quarter 2022 showed -0.90%, and when combined with the first quarter of 2022 at -1.60%; showed we have a “technical” recession in place – which economists historically cited two back-to-back quarters of negative GDP signaled a recession. The GDP data is accurate and when combined with many recent missed EPS releases by companies such as Intel and Proctor & Gamble certainly point to a slowing economy, which goes into the Fed’s decision to consider a pivot sometime in late 2022-23. A pivot means lower interest rates in the future and that is what the markets are rallying on. Chart 2 (from FactSet) shows the broad performance of several major indexes thus far in the 3rd Quarter 2022. Every sector is higher, led by the NASDAQ. 

Policy and Politics 
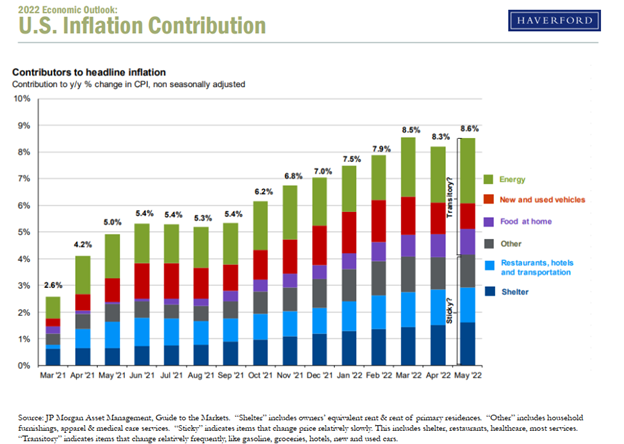
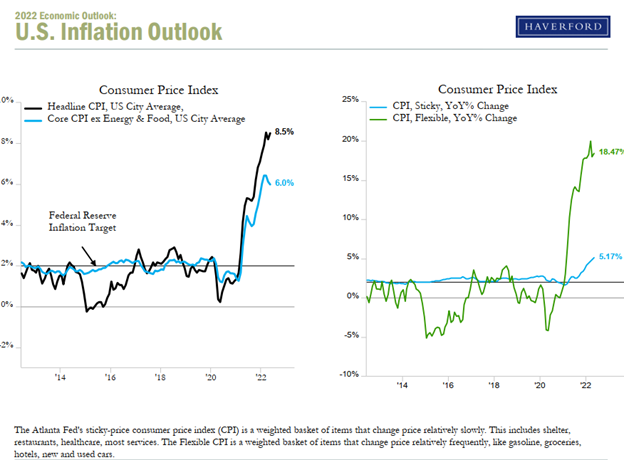
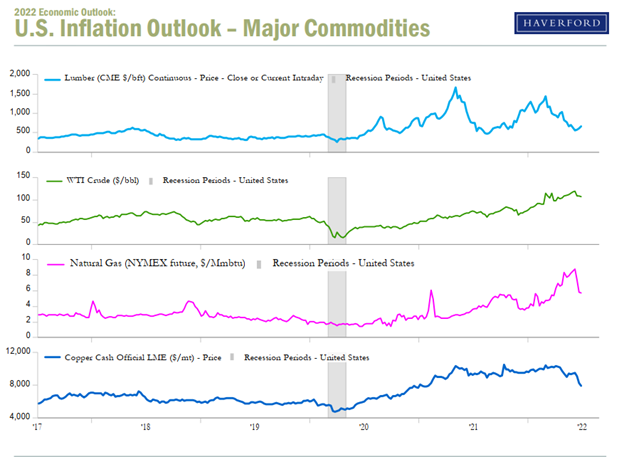
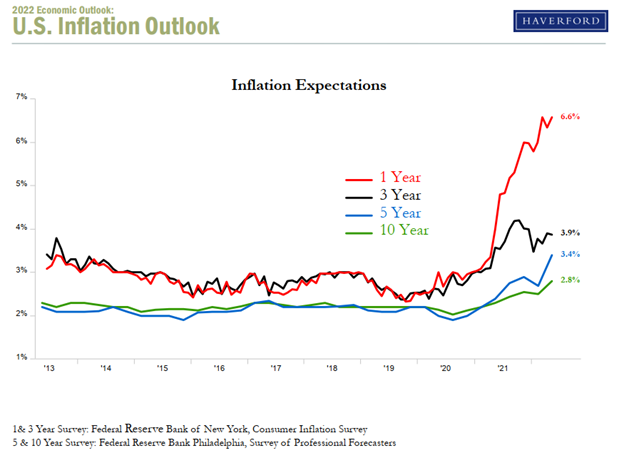
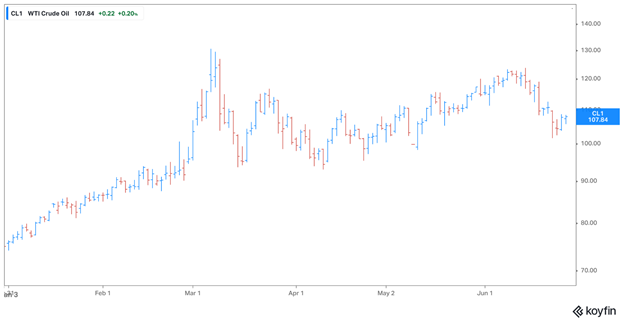
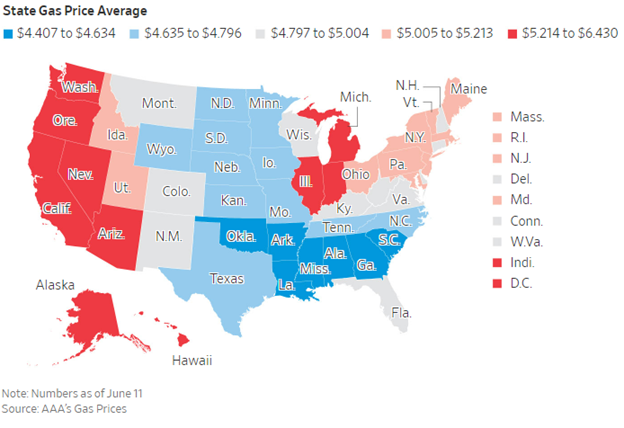
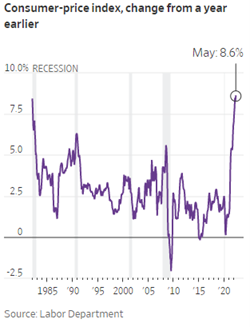
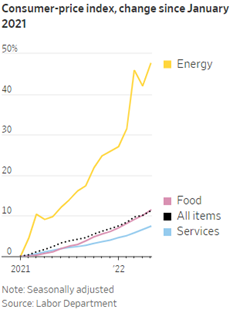
The markets are banking on the Fed doing its job in combating inflation, however we have yet to see any indication that inflation is moderating except in lower commodity prices as we discussed last week. For the markets to continue their recovery, we must see some real impact on the inflationary pressures impacting consumers. Note that gasoline prices are well off their highs of $4.50-5.00/gallon, and this is a commodity that immediately impacts all consumers. Further downward pressure on gasoline could be seen in the months ahead as global economies cool and demand for oil lessens.   

What to Watch 

  • August 4th U.S. Initial Jobless Claims estimate +249,000 vs prior month +256,000 
  • August 5th U.S. Non-farm payrolls estimate +250,000 vs prior month of +372,000 
  • August 5th U.S. Unemployment rate estimate 3.6% vs prior rate of 3.6% 

Current Market Observations

Although the market was dealt some mixed signals on the economy and earnings, overall, we ended resoundingly positive by week’s end and all three major indexes posted strong gains. Preliminary July manufacturing and services sector reports all signaled slowing business activity, notably for the U.S. services sector, conversely, Q2 earnings season kicked into a higher gear and of the 104 S&P 500 companies that have reported, 56% have topped revenue forecasts and approximately 72% have bested profit projections, per data compiled by Bloomberg. Many investors feel the best indicator of future economic growth is the stock market and that gauge helps in projecting a coming recession. Several prognosticators are predicting a recession within the next few quarters. It seems likely that we will have a technical recession (two quarters of negative Gross Domestic Product), but we believe a cyclical recession (one where there is severe employment destruction) is unlikely. We take a deep dive into several recession-related economic indicators below. For the week, the Dow Jones Industrial Average rose +2.0%, the S&P 500 Index +2.6%, and the NASDAQ moved higher by +3.3%. The 10-year U.S. Treasury Bond fell 16 basis points last week to close the week at 2.77%, once again giving investors over 1.00% for the week, and solidly inverting the yield curve. 

Markets (as of 7/22/2022; change YTD) 

Domestic Economy 

Chart 1 below (from the Federal Reserve Bank of St. Louis) shows the 10-2 Treasury yield spread, which is the difference between the 10-Year U.S. Treasury Yield and the 2-Year U.S. Treasury yield. A spread that approaches zero, or in the current market, is negative, (meaning an investor is getting less return for extending their bond’s maturity) has historically been a precursor to a recessionary period. However, the time between an inverted yield curve and a recession ranged from 6 to 24 months afterwards; meaning, this is a far-leading indicator. As noted above, the 10-Year U.S. Treasury fell again last week, hitting 2.77% down significantly from the 3.48% yield it hit in June of this year. It is likely that institutional investors who are still sitting on piles of uninvested cash saw the 10-Year U.S. Treasury yield above 3.00% compared with recent anemic levels well below 1.00% as an attractive investment and that move back into Treasuries has pushed yields lower. 

Chart 2 below (from Valley National Financial Advisors and YCharts, recessions shaded) shows the Composite of Leading Indicators by the OECD. The index is published monthly by The Conference Board. It is used to help predict the direction of global economic movements in future months. The index is composed of 10 economic components, such as: employment activity, manufacturing orders, and stock market behavior. Businesses and investors can use the index to help plan their activities around the expected performance of the economy and protect themselves from economic downturns. This indicator turned negative in September of 2021, predicting a recession was looming as every previous recession saw a sharp drop in the Composite of Leading Indicators.  

Chart 3 below (from Valley National Financial Advisors and YCharts, recessions shaded) shows U.S. Unemployment rate and U.S. Existing Home Sales charted since 2000. We see how in previous recessions unemployment rose dramatically and home sales slowed. Currently, we have the opposite where unemployment is at an historic low of 3.6% and home sales, while slowing a bit due to recently higher mortgage rates, are still strong. With these two indicators continuing to refute a looming recession we believe a cyclical recession is unlikely in the near term. 

Last week we showed how several measures of inflation were starting to come down. Key commodities like copper, lumber, and oil are down from recent highs and manufacturing activity is slowing. Also, gasoline prices, a critical component in everyday spending, is down from recent highs. This data suggests the FED’s path to higher rates is slowing record high inflation and is impacting the super-hot economy. We show above that housing and employment remain strong rebutting calls for a looming recession. We never fail to remind readers how important the consumer is to the U.S. economy – fully 65-75% of economic activity is related to consumer spending and the consumer remains in particularly good financial health; especially when gauged by debt levels, savings accounts and still relatively low (by historic standards) mortgages rates. Pay close attention to the stock market – the true leading indicator of economic activity. The S&P 500 Index is up 5.23% since mid-June 2022, when we continued to see a softening in inflationary data. 

Policy and Politics 

  • The FOMC meets this week and is expected to raise rates 75 – 100 basis points. 
  • Chairman Powell’s press conference will help us understand future moves 

What to Watch 

  • U.S. New Single-Family House Sold will be released at 10:00AM ET on July 26th. 
  • Target Federal Funds Rate Upper Limit will be announced at 2:15PM ET on July 27th. 
  • U.S. Real 2nd Quarter GDP Quarter over Quarter will be released at 8:30am on July 28th
  • U.S. PCE Price Index YoY (the FED’s preferred inflation gauge) released at 8:30am on July 29th

Current Market Observations

Earlier negative data on inflation (U.S. Consumer Price Index) for June 2022 +9.1% Year Over Year rocked the equity markets and pushed investors to the relative safety of U.S. Treasury bonds. However, by the end of the week, two new pieces of inflation data (Empire State Manufacturing Prices Paid and Consumer Inflation Expectations) both moved sharply lower indicating that inflation may have peaked, and the markets snapped back nicely on Friday, although not enough to end the week in positive territory. For the week, the Dow Jones Industrial Average fell –0.16%, the S&P 500 Index lost –0.93% and the NASDAQ fell –1.57%. We take a deep dive look at inflation below. The 10-Year U.S. Treasury Bond fell 16 basis points last week to close the week at 2.93% giving back investors 1.00% of return on the year. 

Markets (as of 7/15/2022; change YTD) 

Global Economy 
President Biden’s trip to the Middle East will not be impacting oil prices anytime soon as he was unable to secure any reasonable increase in oil production from Saudi Arabia. A look at Chart 1 (from Haverford Trust and JP Morgan) shows Contributors to Headline Inflation since March 2021. Note: energy and shelter (housing) continue to be the largest contributors. Both can be easily impacted by prevailing market trends and quickly as is evidenced by gasoline prices retreating from recent highs. 

Chart 1: Contributors to Headline Inflation 

As noted above, we want to do a deeper dive into inflation data hitting the wires. Inflation can be broken down into “sticky” vs “flexible.” See Chart 2 below (from Haverford Trust and the Atlanta Fed) showing CPI broken into Sticky (shelter, healthcare, restaurants) and Flexible (energy, groceries, cars) components. What is important is that the larger share of the current inflation spike is flexible; and therefore, can come down quickly (again evidenced by the recent drop in gasoline prices. Further, see Chart 3 (from Haverford Trust) showing Major Commodity Prices and how they all are down dramatically from their recent highs. 

Chart 2: Consumer Price Index (Sticky Inflation vs Flexible Inflation) 

Chart 3: Major Commodities Prices 

Lastly, as we mentioned last week, expectations for future inflation are drastically different than current inflation trends. Importantly, consumers and the markets are not pricing in continued hot inflation data beyond one year hence. See Chart 4 below (from Philly Fed, NY Fed, & Haverford Trust) showing the 1, 3, 5, and 10-Year Consumer Inflation Expectations. As the markets, consumers and Fed Chairman Jay Powell digest this predictive inflation data, we could see some stabilization in the markets. Watch for earnings releases and employment data as each of these could show where potential weaknesses exist. 

Chart 4: 1, 3, 5 and 10-Year Consumer Inflation Expectations 

Policy and Politics 
The Federal Reserve is preparing to raise rates by another 75bps later this month to combat inflation, although a 100bps move is also on the table. 

Senator Manchin struck down the Global Minimum Tax proposal, which would require a 15% tax on multinational corporations around the world. 

What to Watch 

  • U.S. Retail Gas Price data will be released at 4:30PM ET on July 18th
  • U.S. Housing Starts data will be announced at 8:30AM ET on July 19th
  • 30 Year Mortgage Rate data will be released at 10:00AM ET on July 21st

Current Market Observations

Despite catastrophic headlines globally such as the assassination of former Japanese Prime Minister Shinzo Abe, and the continued war ravaging Ukraine, the main market influencing issue is the seemingly unstoppable inflationary pressures worldwide.  Further, China is again attempting to solidify its military grasp on Hong Kong. Regardless of these negative headwinds, the markets turned in a decisively positive week with the Dow Jones Industrial Average returning +1.8%, the S&P 500 Index notching +3.0% for the week and the NASDAQ returning a healthy +5.5% last week.   

Markets (as of 7/8/2022; change YTD) 

Global Economy 
30-year fixed mortgage rates in the U.S. dropped for the second week in a row, from 5.70% to 5.30%. This is the largest weekly decline since the Global Financial Crisis, when rates fell from 5.97% to 5.53% in December 2008. Chart 1 shows mortgage rates over the prior year. This decrease reflects widespread recessionary fears and an obvious slowing in the housing sector. 

Chart 1: Average rate on a 30-year fixed mortgage 

Chinese annual inflation numbers surprised to the upside in June with China’s National Bureau of Statistics claiming that consumer prices rose by 2.5%, up from 2.1% in May and higher than the expected 2.4%. Production prices remained lower with 6.1% inflation, down from 6.4% in May and down from the recent high of 13.5% recorded in October 2021. 

Last week, Federal Reserve Chair Jerome Powell acknowledged that the recent 75 basis point rate hikes increase the chances of an economic downturn in the foreseeable future. The stated idea behind this is to prevent a shift in consumer psychology that inflation will persist, which would create an inflationary feedback loop. Chart 2 shows consumers’ inflation expectations over the next one and five years; with the salient point being that consumers do not believe inflation to be long-lasting, at this point in the economic cycle. 

Chart 2: Consumers’ inflation expectations 

Policy and Politics 
As Congress reconvenes in Washington this week, several items are on the agenda, including the potential codification of abortion rights into federal law, the onshoring of semiconductor manufacturers to the U.S. as part of the China bill, lowering prescription drug prices, and potentially raising taxes on corporations and high-income households.  

What to Watch 

  • Both month-over-month and year-over-year U.S. Consumer Price Index data will be announced at 8:30AM EST on 7/13. 
  • U.S. Inflation Rate data will be announced at 8:30AM EST on 7/13. 
  • Both month-over-month and year-over-year U.S. Producer Price Index data will be announced at 8:30AM EST on 7/13 

Current Market Observations

Little is changing week-to-week regarding inflationary and recessionary outlooks. Pricing levels across many commodities have softened, slightly easing inflation concerns. The Russo-Ukraine war continues to carry on as Russia begins to use its agricultural power as leverage in negotiations and sanctions. China continues its Zero-COVID policy with city-wide lockdowns, quarantines, and testing. Remember, times like these pose significant opportunity for long-term investors regardless of short-term tumult.

Markets (as of July 1st, 2022; change YTD)

Global Economy
Due to lockdowns across China, economists expect the country to fail to meet its 5.5% GDP growth goal. There is, however, a potential silver lining to this: slowed global inflation.

Russia’s control over agricultural exports is being utilized as leverage towards easing sanctions and in cease-fire negotiations.

Policy and Politics
The Biden administration is blocking new oil-drilling permits within the Atlantic and Pacific, while also allowing for very limited permits in the Gulf of Mexico and Alaska in an attempt to reduce reliance on foreign oil. Jeff Bezos also criticized White House pressures for gas stations to lower prices, calling it a “misdirection” and “deep misunderstanding” of market forces.

The Biden administration is considering a move to lower mortgage rates for first-time home buyers in lower income brackets as the median home price in the US ticks over $400,000 for the first time. However, experts are weary of these plans as they don’t “meaningfully address the supply-side problem.”

What to Watch

  • US retail gas price figures to be released at 4:30PM EST on July 5th. Prior figure was $4.979/gal.
  • ADP Nonfarm Payroll month-over-month figures to be released at 8:15AM EST on July 7th.

Current Market Observations

In a reversal of fortunes for investors, the markets, both stock and bond, came roaring back last week with Dow Jones Industrial Average moving higher by +5.3%, the S&P 500 Index moving +6.7% higher and the NASDAQ surging +9.0%. Further, bonds, which have suffered their worst year-to-date start ever, moved higher in price for the week. The yield of the 10-Year U.S. Treasury bond dropped to 3.13% on Friday, down from a recent high on June 14 of 3.48%. These moves were precipitated by comments from Fed Chairman Jay Powell about the continued fight to quell inflation and some major commodity prices such as oil and copper falling during the week.  

Markets (as of EOD 6/24/22; change YTD) 

Global Economy 
Globally, markets rallied as investors concluded that Central Banks around the world would not need to be as aggressive as originally expected in raising rates but could temper their plans as inflationary pressures have already started to abate. Germany, which had been crimped by energy shortages due to Ukraine/Russia war sanctions, moved to “Alarm Stage” allowing emergency plans for energy production and procurement. This would allow, for example, the opening of previously closed coal plants. As a result, crude oil prices continue to fall. (See Chart 1 below from Koyfin). Russia is widely expected to default on their bonds this week, adding one more negative implication resulting from their attack on Ukraine. 

Chart 1: West Texas Intermediate (WTI) Oil Price at $108/barrel down from $120/barrel 

Policy and Politics 

Powell spent two days testifying to the U.S. House of Representatives and the U.S. Senate. When pressed, he confirmed that the Fed is committed to combat inflation and is confident their actions are already having an impact. Further, Powell pointed to their own projections that show continued Gross Domestic Product (GDP) growth rather than a recession, for which several Wall Street prognosticators are calling. See Chart 2 below from Bloomberg & the Federal Open Market Committee (FMOC) showing Fed projections for GDP out through 2024. Historically, weakness in the labor market proceeded a recession and we are far from labor weakness in the U.S. In fact, all typical labor indicators: the unemployment rate, job openings vs available workers, and the labor force participation rate are all solidly strong; thereby in our opinion, weakening the argument for an upcoming recession. 

Chart 2 

What to Watch 
We have a big week ahead for economic indicators including the Fed’s preferred measure of inflation U.S. Core PCE (Personal Consumption Expenditures) on Thursday, June 30. Further, watch for housing related data on Tuesday, June 28 with the Case-Shiller Home Price Index.  

It is important to take a long-term perspective on investing. A recent chart by LPL Research and FactSet helped cement our opinions. 2022 has been a horrible start to the year for both the stock and bond markets with double-digit negative returns in both the S&P 500 Index (-17.3%) and the Bloomberg U.S. Aggregate Bond Index (-10.7%). However, history has shown us the benefit of waiting it out and staying invested. See Chart 3 below showing that every time since 1928 (almost 100 years) when the S&P 500 Index was down at least -15% in the first half of the year, returns were positive in the final six months, with an average of +24%. 2020 was the most recent year.  We leave you with that timely and prescient thought and to invite you to reach out to your advisor at Valley National Financial Advisors at any time. 

Current Market Observations

The hope for some immediate relief to investors faded as on as the markets faced their worst week since March 2020, with the S&P entering bear market territory early in the week. Consumers are not in a much better situation, as inflation lingers on the budgets of Americans everywhere and the summer saga of travel-related increased gasoline consumption will be met with rising energy prices. Regardless of the current market and economic environment, we must remember the value of staying invested and opportunities presented during periods of turmoil.

Markets (as of 6/19/22; change since 1/1/22)

Global Economy
Treasury Secretary Janet Yellen provides little relief on the inflation front, stating that high prices are expected to continue rising for the remainder of the year, coupled with a prediction of slowed economic growth. Chart 1 depicts the probability of a U.S. recession.

Chart 1: Probability of U.S. Recession

The tried and true “balanced” portfolio allocation model (60% stocks and 40% bonds) is set to endure a worse quarter than any during the bear market of 2008 (Chart 2). Unlike the era of the Global Financial Crisis, bonds are offering little relief to the sharp pains of the equities markets. The top 1% of wealth in the U.S. lost over $1.5 trillion this quarter, as they own more than half of all equities held in America.

Chart 2: Quarterly Change in 60/40 Portfolio

Policy and Politics

  • Concerns are growing over the international status of the Taiwan Strait, as the Biden Administration interprets the assertive language used by Chinese officials in Beijing to describe the nautical powerhouse.
  • Colombia has followed in the footsteps of previous Latin American countries before them and elected their first radical leftist, President Gustavo Petro, in a close race with his corporate-centered opponent Rodolfo Hernandez. Investor concerns around the situation are growing as Petro’s plans include phasing out oil production/consumption, tax increases on the wealthy, and creating a stronger bond with its neighbor, Venezuela.

What to Watch

  • Fed Chair Jerome Powell’s semi-annual Congressional testimony begins on 6/22/22 at 9:30am EST and continues 6/23/22 at 10:00am EST.
  • Initial Jobless and Continuous Claims report will be released on 6/23/22 at 8:30am EST.
  • The final Michigan Consumer Sentiment report will be released on 6/24/22 at 10:00am EST.

Chart 3: Primary Mortgage Market Survey

Current Market Observations

by Jonathan Susser, Investment Technology Associate
Little seems to be changing week-to-week in terms of consumer sentiment and the markets—that is that both are hitting recent lows. Russia’s invasion of Ukraine rages on, inflation hits a multiple decade high, and COVID remains a concern in China due to city-wide quarantines and lockdowns. Despite all of these apparent headwinds, history tells us that markets, even violently turbulent ones, recovery and investors are best suited with proper planning and commitment to long-term strategies.

Markets (as of 6/10/22; change since 1/1/22)

Equities (+/- %) Dow Jones: 31,392.79 (-13.61%)S&P 500: 3,900.86 (-18.16%)NASDAQ: 11,340.02 (-27.52%)  Commodities (+/- %) Gold (spot): 1,874.51 (3.37%)Oil (Brent): 119.91 (54.92%)Wheat (bushels): 1,090.50 (28.75%)
Interest Rates (+/- bpts.) UST-2 Yr.: 3.06 (+228 bps)UST-5 Yr.: 3.25 (+188 bps)UST-10 Yr.: 3.15 (+152 bps)Currencies (appreciation: +%; depreciation: -%) € (EUR/USD): 1.049 (-7.74%)£ (GBP/USD): 1.227 (-9.17%)₽ (USD/RUB): 55.750 (-24.83%)

Global Economy
The average price of a gallon of gasoline in the USA broke the $5 per gallon threshold on Friday for the first time, contributing to high inflation across various industries, including food and other necessities. Chart 1 below illustrates the average price of gasoline on a state-by-state basis.

Chart 1: State Gas Price Average

U.S. inflation numbers hit 8.6% on an annualized basis in May, making the month’s rate the highest since December 1981. Charts 2 and 3 showcase both the year-over-year CPI changes as well as CPI changes across industries from this year alone.

Chart 2: Consumer Price Index, Change from a Year Earlier

Chart 3: Consumer Price Index, Change since January 2021

Policy and Politics
The leaders of several European Union members will be meeting with President Zelensky later this week in order to discuss recent Russian gains in Ukraine. Zelensky has requested additional weapons and arms from Western countries to help combat Russia’s invasion attempt.

Mexican president Andrés Manuel López is attempting to nationalize several foreign-owned private companies’ energy assets, such as a fuel import terminal owned by KKR & Co and an 1,100-megawatt power plant owned by Iberdola SA. López is hoping to shift to a “Mexico-first” policy path focused on the domestic producers of natural resources. Chart 4 shows the annual change in Mexico’s GDP vs the U.S. under several presidents’ tenures.

Chart 4: Mexican GDP Growth versus the U.S.

What to Watch

  • Month-over-month U.S. business inventories to be released on 6/15/22 at 10:00am EST.
  • U.S. Building Permits data to be released on 6/16/22 at 8:30am EST.
  • U.S. Housing Starts will be announced on 6/16/22 at 8:30am EST.

Current Market Observations

by William Henderson, Chief Investment Officer
Continued strong employment data and little movement on inflationary pressures give us no reason to expect the Fed to veer off their hawkish path towards higher interest rates, and prompted stocks and bonds to sell off last week. 

Markets (as of June 3, 2022, Weekly Returns, Year-To-Date Returns) 

In any normal economy (over the past 20+ years), near-record low unemployment, strong jobs data and a healthy labor participation rate, would signal a growing economy and give the stock market reason to celebrate. Well, not this year; with inflation running at 40-year highs, a war raging in Europe, supply shortages, and a lingering global pandemic throwing such a pall over the markets that nothing stems their move lower.  

The approximately 1% drop in each major stock market index last week came after the previous week’s 7% rally in prices so a modest pullback was not too unexpected. Along with this modest pullback, we have seen a decline in the index that investors use to measure volatility. The Chicago Board of Options Exchange (CBOE) Volatility Index (VIX) moved down to a level of 25 on Friday from a recent high of 35 on May 9. A falling VIX typically points to calming markets rather than the violent 500-point swings we have seen earlier in the year. (See the chart below from the Federal Reserve Bank of St. Louis showing the VIX). 

While volatility may be declining several key Wall Street players are sounding the alarm on financial conditions and related market expectations. What puzzles us is that their concerns are not new, unique, or unknown to the markets. They point to supply chain disruptions, global inflation, higher interest rates, Russia/Ukraine war, and China’s COVID lockdowns as major disruptors to the markets and the economy. We would counter that with the strongest labor market we have seen in decades, near-record low unemployment, consumers and corporations that are flush with cash, and a solid housing market that gives the U.S. economy enough protection to weather a financial storm. Recession risks have been mentioned since the yield curve inverted earlier this year but given the labor conditions a recession seems a long way off. Lastly, inflation, while certainly still running hot and impacting consumer confidence, has recently started to temper, and we will get an important indicator this Friday when the Consumer Price Index report is released for May 2022. A month earlier, the government reported that inflation accelerated in April at an 8.3% annual rate—slightly below the previous month’s 8.5% figure, which was the highest since 1981.  With such poor returns in stock and bond markets for the year, it is hard to see a calm pathway for the remainder of the year, but our economy is 65-70% consumer-driven and much of that is service related rather than goods related. Inflation has thus far largely impacted goods rather than services. Consumers are showing amazing resilience in service-related spending on things like cruises, movies, and restaurants all while they continue to hoard cash and pay down debt. The market headwinds are neither new nor unknown, but they are persistent and that is what is worrying our friends at the Fed. The Fed will keep raising interest rates as long as inflation is persistent and the impact on the economy from higher rates is nominal. Our objective as investors, not market timers or traders, is to focus on long-term investing and planning and to ignore the noise. 

Current Market Observations

by Jonathan Susser, Investment Technology Associate
Markets notch first positive week in eight weeks.  Fed takes a dovish pivot with two Federal Reserve Bank Presidents walking back an aggressive Fed. 

Markets (as of May 27, 2022, Weekly Returns, Year-To-Date Returns) 

Global Economy 

  • U.S. allies are pushing back against a Chinese proposal for deeper security and trade ties in the Pacific, a region that has long been a point of contention between Washington and Beijing. They warn this is an attempt by China to gain control over the region and wrest loyalties from the U.S. 
  • The U.S. Central Bank is weighing the possibility of introducing digital currency to provide consumers safety amidst a sea of cryptocurrency stable coins.  

Policy and Politics 

  • Robert Califf, head of the U.S. Food and Drug Administration proposed a national stockpile of baby formula in order to better prepare for potential future shortages. 
  • Antony Blinken reiterated that the Biden administration is committed to bolstering domestic investment and strengthening ties with allied countries in order to counter China via an inclusive, transparent international policy.

What to Watch 

  • Case-Shiller Home Price Index: National figures are set to release on Tuesday, May 31st at 9:00 AM EST. 
  • U.S. Crude Oil production figures are being released on Tuesday, May 31st at 3:30 PM EST. 
  • U.S. Recession Probability Index to release latest update on Wednesday, June 1st at 11:00 AM EST. 
  • ADP Nonfarm Payrolls to be announced on Thursday, June 2nd at 8:15 AM EST. US Nonfarm Payrolls to follow on Friday, June 3rd at 8:30 AM EST.