Current Market Observations

Equity markets were mixed last week, with the Dow Jones Industrial Average falling –1.1% while the S&P 500 Index (+0.1%) and the NASDAQ (+0.5%) posted modest gains. Bond yields rose, and the 10-year US Treasury moved above 4.00% again, closing the week at 4.06%. Strong labor market data released last week and a slight drop in the unemployment rate helped push yields higher. There was a bit of conflicting data, with the ADP jobs report showing +479,000 new jobs and the BLS (Bureau of Labor Statistics) showing +209,000 new jobs. While conflicting data for sure, both figures show that we continue adding jobs while inflation slips downward. This recent data certainly gives the Fed the cushion to continue increasing rates as we move into the summer. See charts and data below.
US Economy 

As mentioned above, the US Unemployment Rate continues to fall, hitting 3.6% last week; see Chart 1 below from the Federal Reserve Bank of St. Louis. This is important because it pushes the case for the mythical “soft-landing” every Fed Chair hopes for when raising rates, as Chairman Jay Powell had done over the past 18 months. A “soft-landing” refers to the ability to slow the economy by raising rates just enough to kill inflation but not destroy demand so much that the economy rolls into a recession. Thus far, Chairman Powell is succeeding. An unemployment rate of 3.6% shows that the labor market remains resilient. 

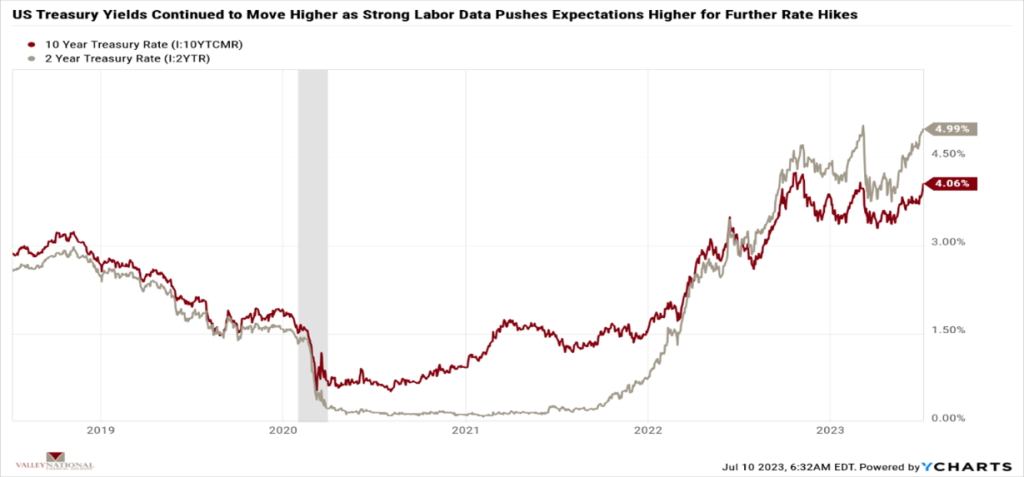
Yields on bonds continued moving higher as markets and investors accepted the fact that higher short-term rates are coming; see Chart 2 below from Valley National Financial Advisors and Y Charts showing the 2-year and 10-year US Treasury yields. The move higher last week in bond yields confirmed expectations that the Fed will raise rates by +0.25% at their next two meetings. While higher rates will continue to slow the economy, we doubt an additional +0.50% will do much, given that markets have already easily digested +5.25% in rate hikes. This is the “soft-landing” Chairman Powell is shooting for – lowering inflation, keeping the labor market alive, and not pushing the economy into a recession.
What to Watch 

  • Monday, July 10th  
  • U.S. Retail Gas Price at 4:30PM (Prior: $3.643/gal.) 
  • Wednesday, July 12th  
  • U.S. Inflation Rate at 8:30AM (Prior: 4.05%) 
  • U.S. Core Consumer Price Index MoM/YoY at 8:30AM (Prior: 0.44% / 5.33%) 
  • Thursday, July 13th  
  • U.S. Initial Claims for Unemployment Insurance at 8:30AM (Prior: 248,000) 
  • Natural Gas Storage Change at 10:30AM (Prior: 72.00B cf.) 
  • 30 Year Mortgage Rate at 12:00PM (Prior: 6.81%) 
  • Friday, July 14th  
  • U.S. Export Prices MoM/YoY at 10:00AM (Prior: -1.85% / -10.13%) 
  • U.S. Import Prices MoM/YoY at 10:00AM (Prior: -0.64% / -5.94%) 
  • U.S. Index of Consumer Sentiment at 10:00AM (Prior: 64.40) 

This week we will get a fresh look at the U.S. Inflation Rate (prior 4.05%) to see if we are moving closer to the Fed’s 2.00% target rate. While most economists have finally walked away from their predictions of a recession in 2023, they have now moved into 2024. We are watching important consumer data as consumer and consumer spending makes up 65-75% of the U.S. economy. Importantly, small indicators like restaurant activity and credit card delinquencies are showing signs of weakening. While certainly expected in a slowing economy, it remains important to us to watch this data. We remain cautiously optimistic about the markets and economy for 2023, hoping like Chairman Powell, that we see a “soft landing.” Contact anyone at Valley National Financial Advisors with questions about this report.

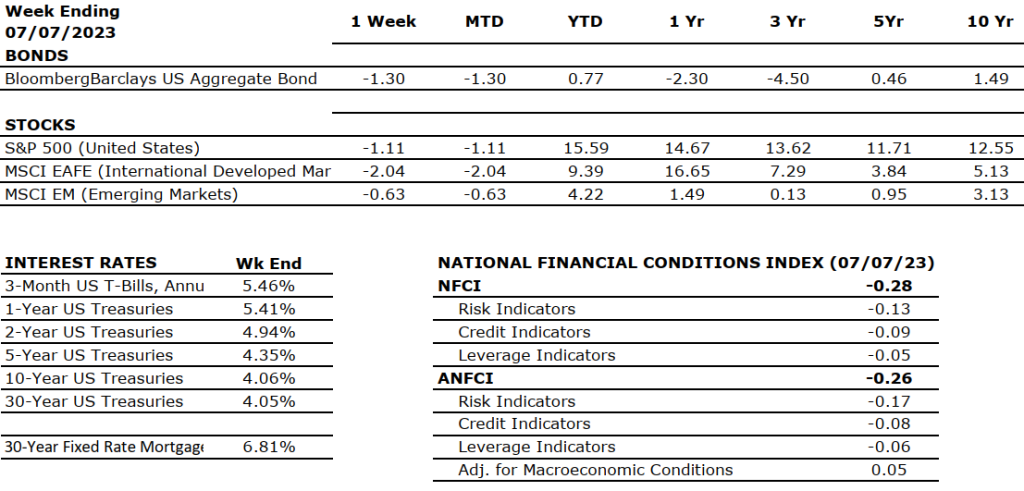
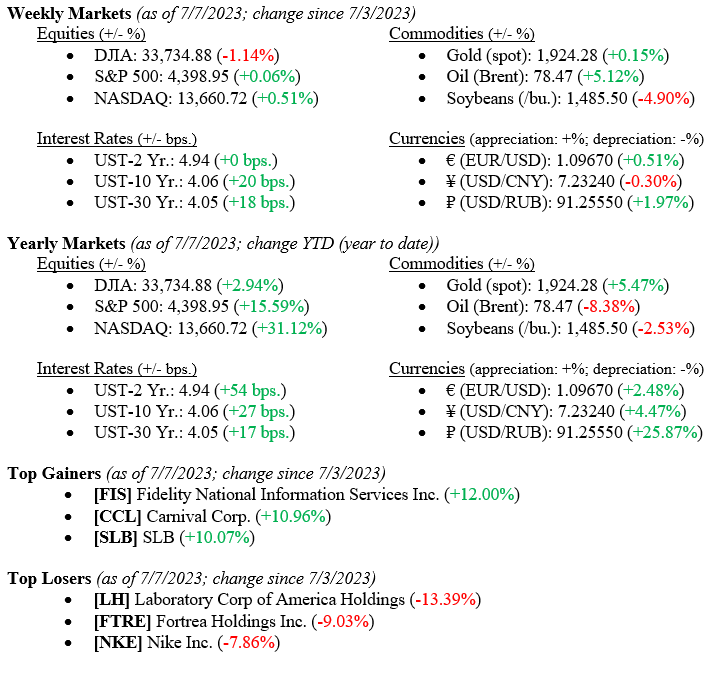
The Numbers & “Heat Map”

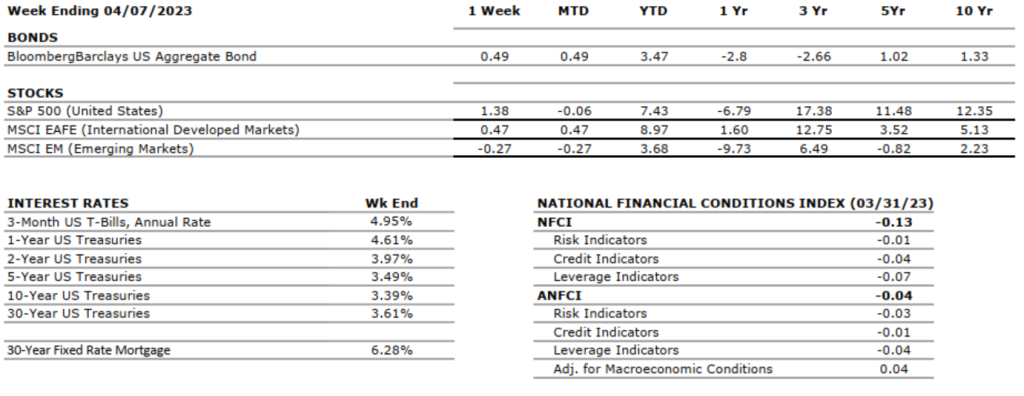
Sources: Index Returns: Morningstar Workstation. Past performance is no guarantee of future results. Indices are unmanaged and cannot be invested into directly. Three, five- and 10- year returns are annualized excluding dividends. Interest Rates: Federal Reserve, Mortgage Bankers Association.

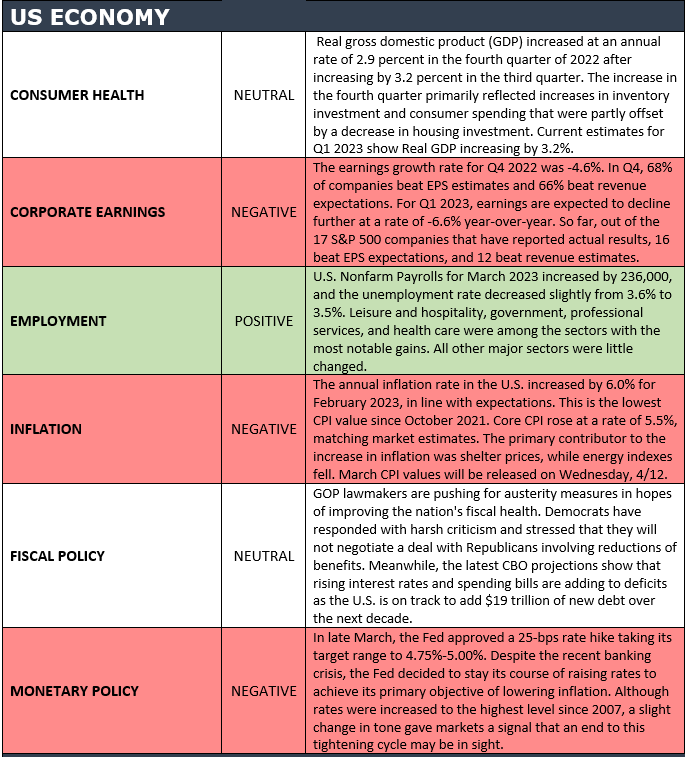
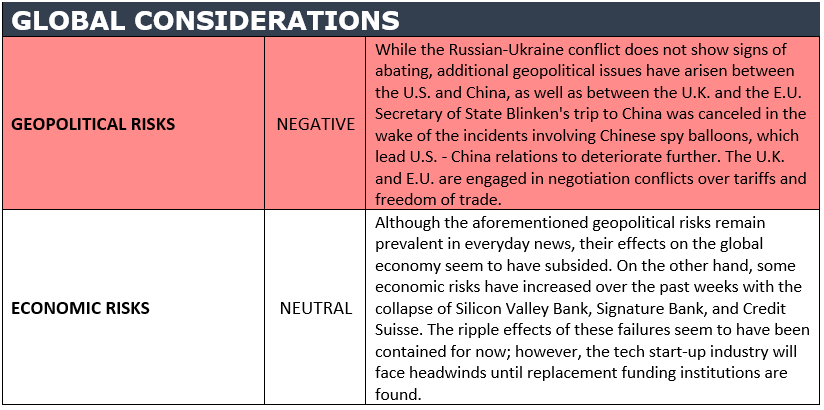
MARKET HEAT MAP

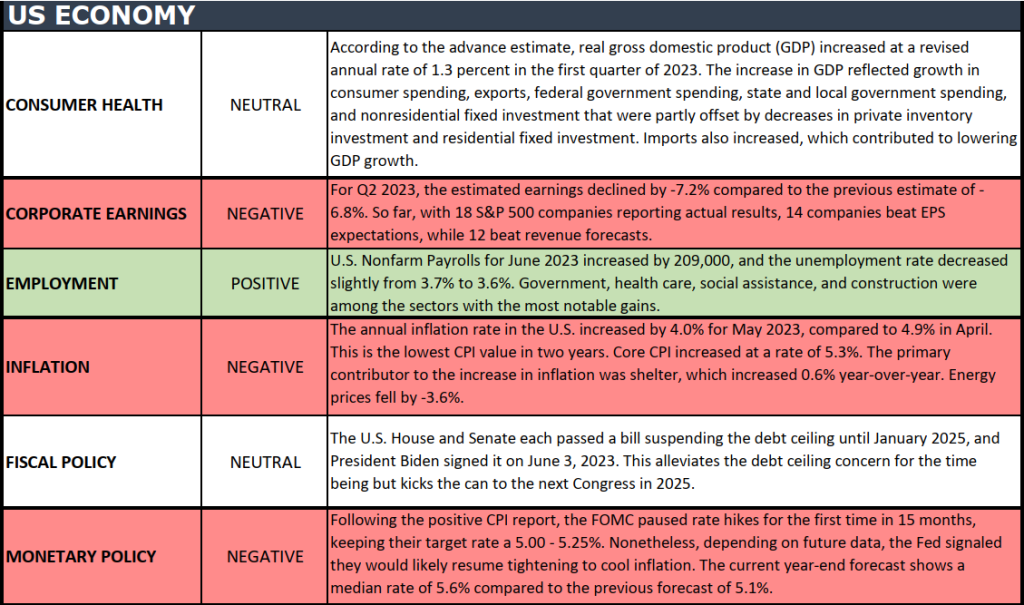
The health of the U.S. economy is a key driver of long-term returns in the stock market. Below, we grade key economic conditions that we believe are of particular importance to investors.

The “Heat Map” is a subjective analysis based upon metrics that VNFA’s investment committee believes are important to financial markets and the economy. The “Heat Map” is designed for informational purposes only and is not intended for use as a basis for investment decisions.

VNFA in the NEWS

Our Chief Executive Officer, Matthew E. Petrozelli, was featured in Lehigh Valley Business as one of the Region’s Power Players in their Banking, Finance, Accounting, and Wealth Management Power List.

“This is a well-deserved recognition of Matt’s hard work and dedication to Valley National Financial Advisors. His leadership has inspired us all,” said Founder & Chairman Thomas M. Riddle, CPA, CFP®.

Matt oversees all the company’s operations and executive leadership. Under Matt’s leadership, vision, and commitment to excellence, our company has achieved tremendous success, and this recognition reflects his remarkable contributions. #TeamVNFA celebrates his continued success!

“Each employee is proud to be part of his team. This acknowledgment confirms the success of the company’s leadership transition as part of the long-term succession plan. Valley National Financial Advisors is celebrating its 38th year of serving its clients. Many more years are assured under Matt Petrozelli’s leadership,” said Founder & Chairman Thomas M. Riddle, CPA, CFP®.

Learn more about our Chief Executive Officer, Matthew E. Petrozelli, and Lehigh Valley Business Region’s Power Players.

Current Market Observations

Although last week’s jobs report showed a slowing in hiring during March 2023, equity markets posted another positive week across all three major market indexes, with the Dow Jones Industrial Average leading the way at +1.91% for the week ended April 7, 2023. Meanwhile, the S&P 500 Index notched a decent +1.34% for the week, while the NASDAQ returned +0.62%. Bond prices increased during the week but only modestly, with the 10-year U.S. Treasury bond falling four basis points to close the week at 3.39%. As recently as October 2022, the yield on the 10-year U.S. Treasury was 4.25%, marking a shocking move in rates due to still-unfounded recessionary fears and a clear flight to quality after the mini-banking crisis we saw in March as Silicon Valley Bank & Signature Bank failed.

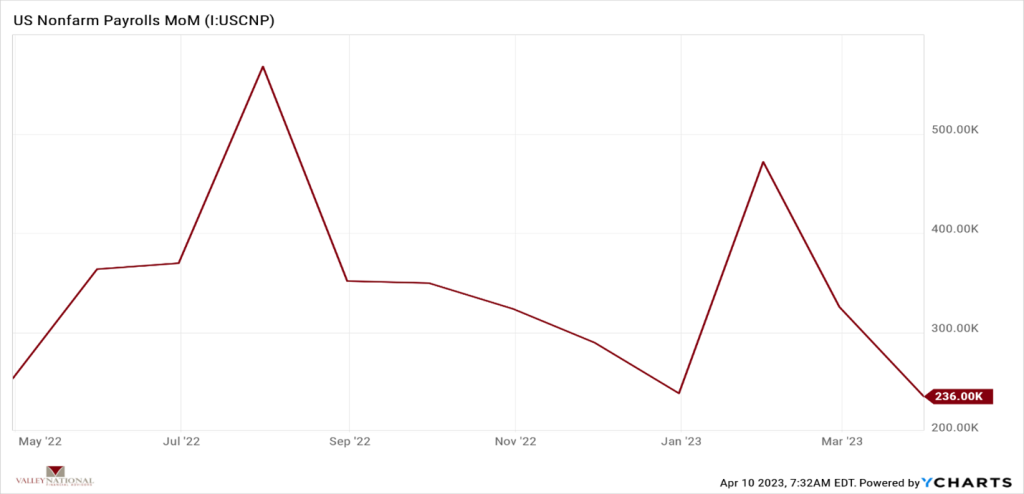
Last Friday’s employment report from the Bureau of Labor Statistics showed the U.S. added 236,000 nonfarm payrolls in March, below the median economists’ forecast of 239,000 and down from February’s revised figure of +311,000, see Chart 1 below. Oddly, the unemployment rate moved a bit lower to 3.5% from 3.6%, and the labor force participation rate increased from 62.5% to 62.6%. At VNFA, these moves are modest and still point to a strong labor market by any historical measure. We continue to believe the U.S. labor market remains a strong point continuing to underpin the economy.

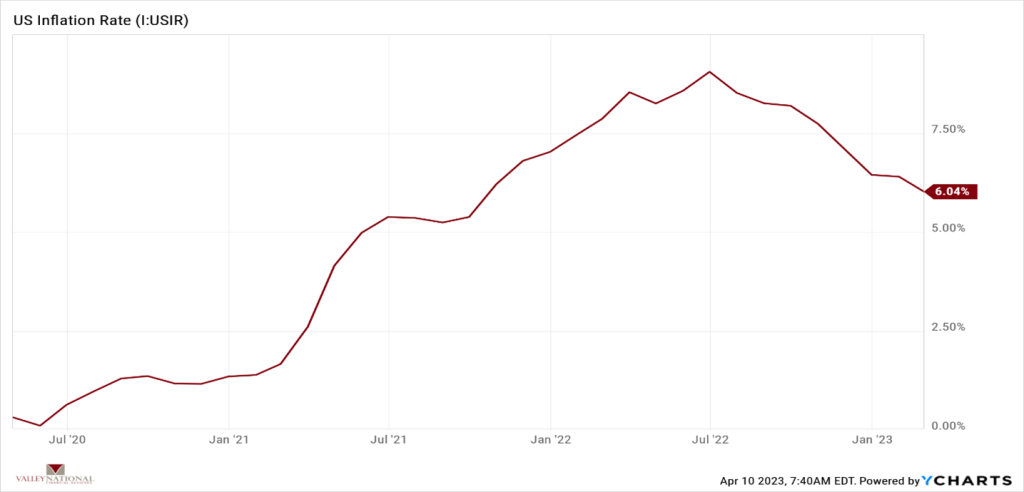
Investors understand the current objective of Fed Chairman Jay Powell is combatting inflation which peaked last summer at 9.06% and has since tapered to 6.04%, see Chart 2 below. Chair Powell has raised interest rates at a near-historic pace, and last year’s markets showed the result of that with poor returns across all sectors. As inflation comes under control and further rate hikes fade into the sunset, we expect markets to moderate but remain volatile. 

What to Watch

  • Monday, April 10th
    • U.S. Wholesale Inventories MoM at 10:00AM (Prior: -0.42%)
    • U.S. Retail Gas Price at 4:30PM (Prior: $3.606/gal.)
  • Wednesday, April 12th
    • U.S. Consumer Price Index MoM/YoY at 8:30AM (Prior: 0.37% / 6.04%)
    • U.S. Core Consumer Price Index MoM/YoY at 8:30AM (Prior: 0.45% / 5.53%)
  • Thursday, April 13th
    • U.S. Producer Price Index MoM/YoY at 8:30AM (Prior: -0.15% / 4.58%)
    • U.S. Core Producer Price Index MoM/YoY at 8:30AM (Prior: -0.00% / 4.40%)
    • 30 Year Mortgage Rate at 12:00PM (Prior: 6.28%)
  • Friday, April 14th
    • U.S. Export Prices MoM/YoY at 10:00AM (Prior: 0.20% / -0.85%)
    • U.S. Import Prices MoM/YoY at 10:00AM (Prior: -0.14% / -1.05%)
    • U.S. Index of Consumer Sentiment at 10:00AM (Prior: 62.00)

Equity markets finished the week slightly higher, while treasury yields fell slightly. Last week, the BLS (Bureau of Labor Statistics) labor report was right on target, missing median expectations by only a few thousand jobs and indicating a strong labor market as participation increased and the unemployment rate decreased. However, the strong jobs market is still running a bit contrary to the Fed’s rate-hike path. It was expected that the historic pace of rate increases would negatively affect workers and put many out of jobs, which has yet to be seen. Despite the continued strength in this area, inflation has trended downwards from a peak of 9.06% and is currently down to 6.04%, indicating that the Fed is putting up a good fight. We believe the path to 4% is ahead of us, while returning to the 2% average target may take years longer than initially expected.

The Numbers & “Heat Map”

Sources: Index Returns: Morningstar Workstation. Past performance is no guarantee of future results. Indices are unmanaged and cannot be invested into directly. Three, five- and 10- year returns are annualized excluding dividends. Interest Rates: Federal Reserve, Mortgage Bankers Association.

MARKET HEAT MAP

The health of the U.S. economy is a key driver of long-term returns in the stock market. Below, we grade key economic conditions that we believe are of particular importance to investors.

The “Heat Map” is a subjective analysis based upon metrics that VNFA’s investment committee believes are important to financial markets and the economy. The “Heat Map” is designed for informational purposes only and is not intended for use as a basis for investment decisions.

Did You Know…?

Easter is also a time to celebrate the arrival of spring!

Easter is a holiday that marks the arrival of spring, new beginnings, and hope. It is celebrated by many people worldwide with traditions such as Easter egg hunts, the Easter Bunny, and springtime festivals. The Easter egg has become a popular symbol of Easter, representing new life and renewal.

The Easter Bunny is another popular symbol of Easter, known for bringing Easter eggs and treats to children who have been good throughout the year. Many people also celebrate the arrival of spring by planting new flowers, enjoying outdoor activities, and participating in community events. As we celebrate Easter this Sunday, Apr 9, 2023, let us cherish our loved ones, enjoy the beauty of spring, and spread joy and kindness to those around us.

Your VNFA family wishes you a joyful Easter filled with love and laughter.