Our team of Financial Advisors is featured in this month’s issue of Lehigh Valley Style magazine. Check out page 39 and share our website with anyone you feel might benefit from learning more about our professional team. Lehigh Valley Style November 2021
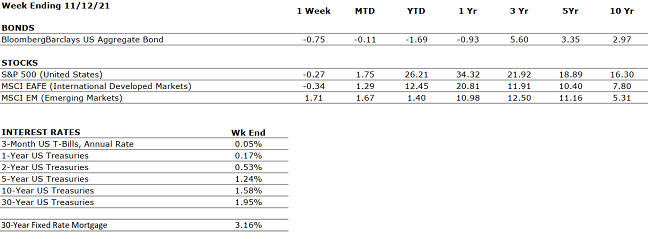
by William Henderson, Vice President / Head of Investments U.S. equities sold off last week as a double dose of poor economic data hit the markets: inflation and consumer sentiment (more on that below). Last week, the Dow Jones Industrial Average rose fell -0.6%, the S&P 500 Index decreased by -0.3% and the NASDAQ dropped by -0.7%. Fortunately, year-to-date returns across all major markets remain strong so last week’s modest sell off did not materially impact returns thus far in 2021. Year-to-date, the Dow Jones Industrial Average has returned +19.8%, the S&P 500 Index +26.2% and the NASDAQ +23.8%. The 10-Year U.S. Treasury moved higher by two basis points closing the week at 1.55% and still well below the 1.74% level reached in March of this year.
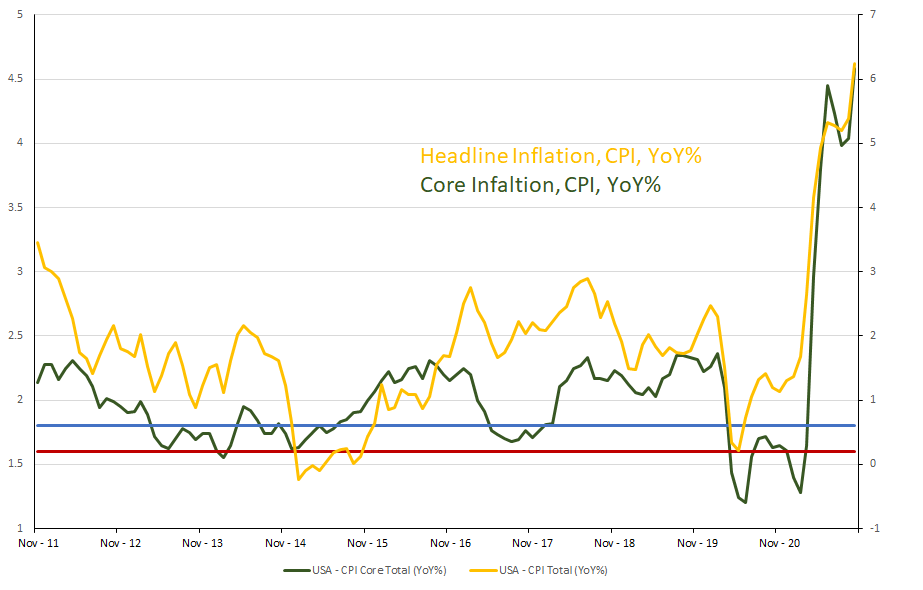
As mentioned, inflation
indicators released last week showed the economy continued to signal
higher prices for many goods and services. Both the Producer Price Index
(PPI) and Consumer Prices Index (CPI)
came in well above economists’ expectations
and reached multidecade highs. The CPI reading was +6.2%, the highest
level since 1991, while the PPI reading was +8.6%,
the highest level since 2010. Some economists shrugged the news off noting
that the data was largely driven by
“transitory” factors like energy and
auto prices but other less transitory factors such as rent, and
wages also showed significant price increases. The markets and consumers
may not like higher inflation, but
this is what the Fed ordered and remember, prior the pandemic
for nearly 10-years, inflation had averaged a paltry
+1.6%, well below the Fed’s mandated target of +2.0%. (See the chart below
from FactSet).
While inflation commonly hangs an
anchor on consumption and growth, we expect higher inflation
to moderate next year as supply chain disruptions, labor
shortages and strong consumer demand eventually
fall back to pre-pandemic, manageable levels. Further, the flexible or
transitory components of inflation, energy, autos, and
food, have
been hardest from supply problems and should
reverse once global pressures ease. However,
the stickier parts of inflation such as wages, rent and
healthcare are not likely to reverse, for example, it is usually very
difficult to reverse salary
increases, once
implemented. If the Fed manages its mandate
well, there will be a balance of prices
between transitory and sticky that allow inflation to average their +2.0% goal.
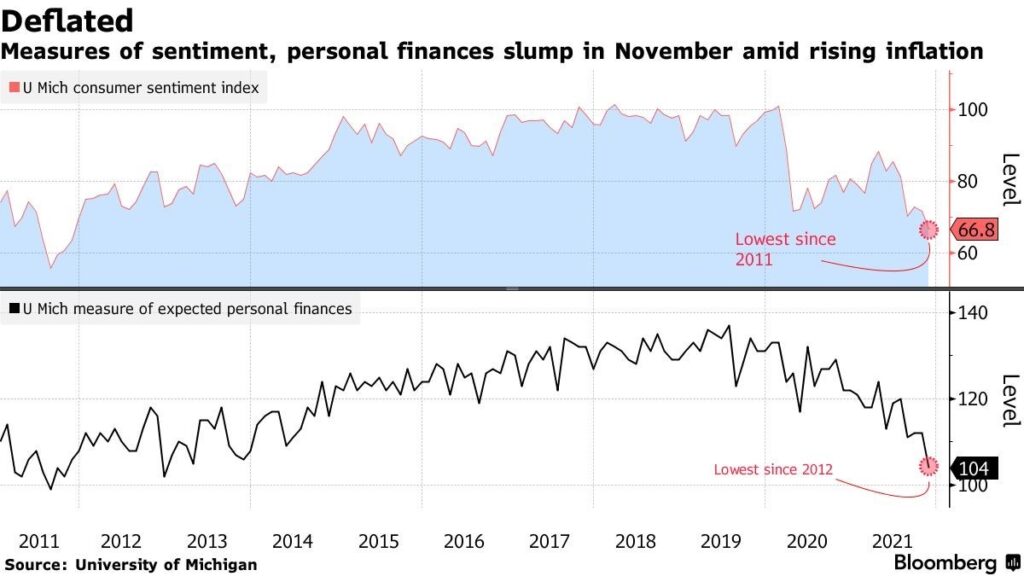
One number released last week that is worrisome was U.S. Consumer Sentiment (previously called Consumer Confidence). The U.S. Consumer Sentiment, as measured by the University of Michigan unexpectedly fell in early November as Americans grew understandably concerned about rising prices and the inflationary impact on their finances. The University of Michigan’s preliminary sentiment index decreased to 66.8 from 71.7 in October. The November figure was well below all Wall Street Economists’ expectations according to a survey by Bloomberg which had called for an increase of 72.5. (See chart below from U Michigan and Bloomberg).
As we have
stated many times, the consumer is the most important factor in the U.S.
economy as consumption makes up approximately 68-70% of GDP in any given year. A
worried consumer is not what an economic
doctor would ever order. With the holiday season kicking off in about one week,
or earlier if you believe TV ads, it will be
interesting to see if the pent up, cash-flush consumer gets out there and
spends money this year. If there is another twist
to this story, it will certainly be what impact
the supply chain disruptions and
clogged ports will have on holiday shopping and
Santa Wish Lists.
From
an investors point
of view, a perfect hedge against inflation,
and a way to protect one’s portfolio from the impact of rising prices is
to invest in equities, which generally outpace
inflation over time. 2021 is a perfect year to demonstrate this. While
expert
economists are crowing about
the +6.2% inflation rate this year, the
S&P 500 Index is up a stunning +26.2%. Always
remain focused on the big picture.
THE NUMBERS Sources: Index Returns: Morningstar Workstation. Past performance is no guarantee of future results. Indices are unmanaged and cannot be invested into directly. Three, five and ten year returns are annualized. Interest Rates: Federal Reserve, Mortgage Bankers Association.
MARKET HEAT MAP
The health of the economy is a key driver of long-term returns in the stock market. Below, we assess the key economic conditions that we believe are of particular importance to investors.
US ECONOMY
CONSUMER HEALTH
POSITIVE
U.S. GDP growth decelerated to a 2% annualized pace in Q3. The slowdown was driven primarily by supply chain constraints. Economists expect a modest acceleration in Q4.
CORPORATE EARNINGS
POSITIVE
With 92% of S&P 500 companies having reported Q3 results, sales and earnings are up 17.5% and 39%, respectively. However, company commentary suggests that the supply chain has been and will continue to be problematic in the coming quarters.
EMPLOYMENT
POSITIVE
The unemployment rate is down to 4.6%, as of October. The labor market is very tight at present many employers, particularly in the Leisure and Logistics sectors, are struggling to fully staff because the labor participation rate remains below pre-COVID levels. The labor shortage is one of the causes of the global supply chain glut.
INFLATION
NEUTRAL
CPI rose 6.2% year-over-year in October, the highest increase since 1990, driven by the global supply chain backlog.
FISCAL POLICY
POSITIVE
A $1.2 trillion infrastructure bill was passed by Congress. An additional $2 trillion tax and stimulus bill proposed by the Democrats will next be voted on by the House & Senate.
MONETARY POLICY
POSITIVE
The Fed will begin bond tapering by November’s end. By mid-2022, all Fed bond purchases will halt. The Fed’s bong buying program works to keep interest rates low.
GLOBAL CONSIDERATIONS
GEOPOLITICAL RISKS
NEUTRAL
Although the Taliban’s control in Afghanistan is concerning, it is unlikely to have a meaningful economic impact.
ECONOMIC RISKS
NEUTRAL
Supply chain disruptions are hampering the economy; however, demand remains very strong. While global logistics are operating far below normal efficacy, it appears the supply chain is slowly improving and may reach normalcy by mid-to-late-2022.
The “Heat Map” is a subjective analysis based upon metrics that VNFA’s investment committee believes are important to financial markets and the economy. The “Heat Map” is designed for informational purposes only and is not intended for use as a basis for investment decisions.
Tune in Wednesday, 6 PM for “Your Financial Choices” with Laurie Siebert on WDIY 88.1FM. Laurie will discuss: Year-End Tax Planning
Laurie can address questions on the air that are submitted either in advance or during the live show via yourfinancialchoices.com. Recordings of past shows are available to listen or download at both yourfinancialchoices.com and wdiy.org.