Did you know… this month (August) in 1985, was the beginning of #TeamVNFA? Get to know our story and how we got here.

Read our story: https://valleynationalgroup.com/about-vnfa/our-story/

Did you know… this month (August) in 1985, was the beginning of #TeamVNFA? Get to know our story and how we got here.
Read our story: https://valleynationalgroup.com/about-vnfa/our-story/
February is National Cancer Prevention Month, which presents a wonderful opportunity to increase awareness and promote positive action toward living happier, healthier lives. Although cancer is still a leading cause of death, it’s essential to focus on the steps we can take to prevent cancer and improve our overall well-being.
Visit AACR for more information on cancer prevention.
U.S. markets have rallied this year, albeit with some pullbacks over the last week. The Dow Jones saw a 2.38% decline, the S&P down 0.27%, and the NASDAQ ended up 1.27% from a week earlier. Additionally, the Federal Reserve is beginning to consider slowing rate hikes as inflation is showing tentative signs of weakening and recession probabilities are gradually declining. This brings us to the U.S. debt ceiling, which is quickly encroaching. Conversations are set to begin in Congress on tackling this, and the Treasury is imploring that they do so urgently. In all, the markets and economy feel as though they’re leveling out to a certain extent—is this the calm before the storm or signs of sustainable healing?
Global Economy
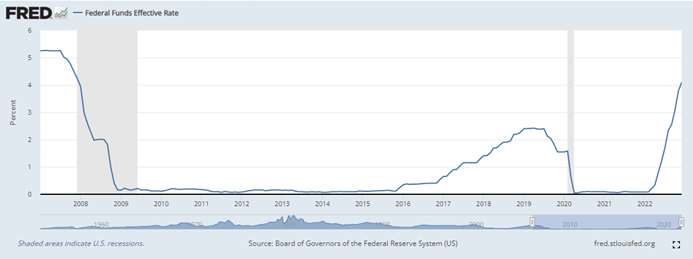
Federal Reserve officials are weighing slowing the pace of interest rate increases yet again from the December hike of 50 basis points, which followed four consecutive months of 75 basis point increases. In recent statements, officials have said that potentially slowing to 25 basis point increases could allow them more time to assess the efficacy of their strategy, as well as determine a reasonable stopping point/pivot. Chart 1 below from the St. Louis Fed’s FRED database shows that the effective federal funds rate is still roughly 100 basis points below rates going into the Global Financial Crisis of 2008/2009. For reference, Goldman Sachs Research is anticipating three more 25 basis point hikes before capping out at the 5.00-5.25% level and holding through year-end.
Chart 1: Effective Federal Funds Rate (01-01-2007 through 12-01-2023)
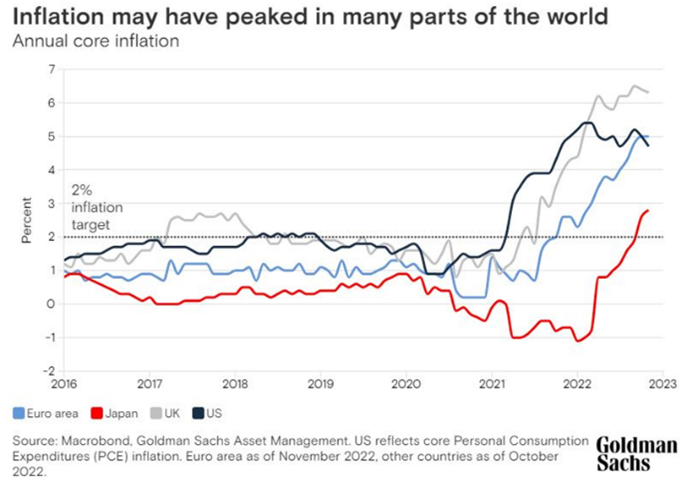
For the past year, the topics of recessions and inflation have been at the forefront of nearly every conversation surrounding the global economy. In a recent survey conducted by Goldman Sachs Research, which interviewed 400 respondents, 57% expect a recession in 2023. Goldman’s economists, on the other hand, do not expect a recession, citing a 35% chance for 2023. Additionally, there are tentative signs that the sticky inflation from 2022 could be decreasing, though that does not necessarily mean that it will fall evenly across those categories. For example, tight labor markets may be unable to slow increasing wages, and commodity supply shocks are possible. Chart 2 below shows annual core inflation from 2016 through 2023 across several geographical regions.
Chart 2: Annual Core Inflation across geographical regions (2016 through 2023)
Policy and Politics
This week, Congress is returning from its short recess and is expected to focus on the typical partisan issues. A Democratic senate will focus on Pres. Biden’s judicial nominees and a Republican house on investigations into the administration on various topics. However, the most pressing issue on Congress’s plate is the ever-approaching debt ceiling, and a path forward for the U.S. President Biden has reiterated that he will not negotiate on debt limits as “[raising the ceiling is the] obligation of this country and its leaders to avoid economic chaos.” House Speaker McCarthy is willing to use the debt ceiling conversation as leverage toward spending cuts, stating, “[we’ll] discuss a responsible debt ceiling increase to address irresponsible government spending.” Regardless of negotiations and concessions, the debt ceiling conversation needs to be sorted out sooner rather than later, as the Treasury would be unable to prevent default if the limit is breached. According to Janet Yellen, the Treasury’s systems are not designed to give priority to bondholders after borrowing limits are exceeded.
What to Watch
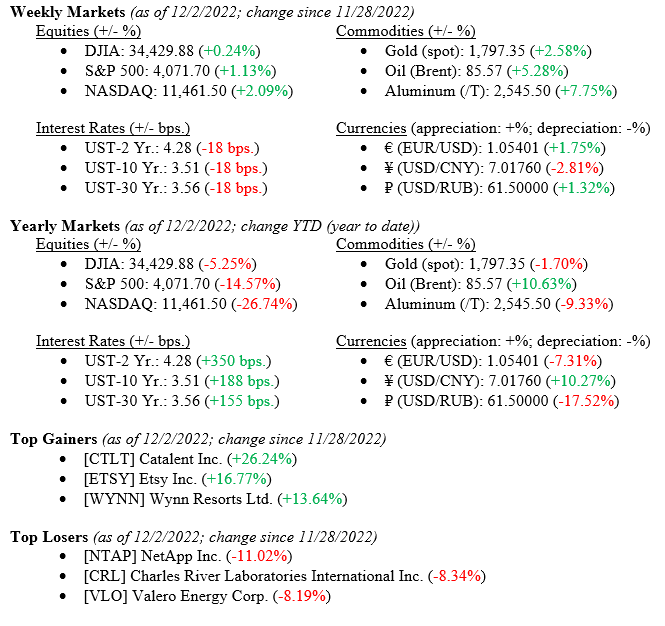
Financial markets posted another weekly gain pushing November to a positive month overall and helping equities post back-to-back monthly gains for October and November 2022. Further, bonds posted positive returns; in fact, their largest monthly gain since 2008. Positive returns in both markets helped balanced portfolios regain a lot of lost ground in markets since the beginning of 2022. See the summary returns immediately below but note importantly that the NASDAQ returned +2.09% for the week while the 10-Year U.S. Treasury fell 18 basis points to close the week at 3.56%. Just over one month ago, the 10-Year Treasury was 69 basis points higher at 4.25%.
Global Economy
Big news last week was Fed Chairman Jay Powell’s speech at the Washington, D.C. Brookings Institute where he confirmed that smaller interest rate increases are ahead and mostly likely as soon as the December FOMC (Federal Open Markets Committee) meeting. Chairman Powell further cautioned that monetary policy would remain restrictive until progress on combating record high inflation continues. Charts 1 and 2, both by Valley National Financial Advisors and Y Charts, show recent downward inflationary trends – PCE (Personal Consumption Expenditures) and Core PCE and U.S. Retail Gas Price.
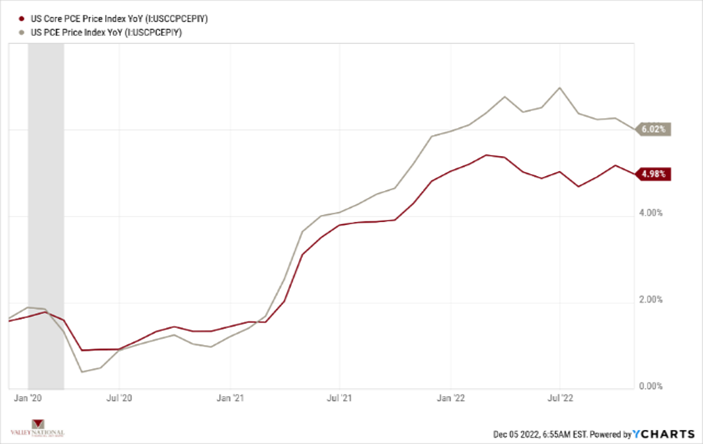
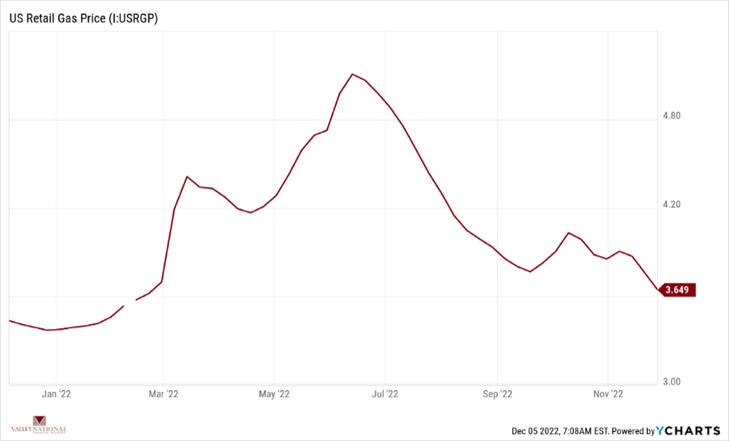
As demonstrated by both charts, the Fed’s tight monetary policy is impacted inflation but clearly more work is needed. We expect to see several rate hikes in 2022-23; albeit modest hikes such as +0.25-0.50%, rather than the aggressive +0.75% rate hikes we have seen thus far in 2022.
Most market prognosticators are still calling for a recession in 2023 solely based on historic patterns and economic data. While a recession may happen in 2023 – by whichever measure is popular now since NBER (National Bureau of Economic Research) does not seem to be the decider any longer – looking at market indicators today (labor, consumer health, bank balance sheets and loan delinquency rates, and corporate earnings), any recession will most likely be modest and short-lived.
Policy and Politics
Several key U.S. and Global issues remain:
What to Watch
Mixed messages abound in the markets today. So-called market experts all suggest a recession is coming in 2022. But U.S. equity markets are rallying (the Dow Jones Industrial Average is up +20% since its October 2022 lows) and U.S. fixed income markets have found a sweet spot as the 10-Year U.S. Treasury has fallen nearly 70 basis points since peaking in October. A recent post by asset manager BlackRock noted that the TINA Trade (There Is No Alternative) has given way to BARB (Bonds Are Back). We believe both remain in place—meaning a balanced and diversified portfolio is the surest path to long-term wealth creation.
“There is virtue in work and there is virtue in rest. Use both and overlook neither.” – Alan Cohen
Tune in to WDIY 88.1FM on Wednesday at 6 PM for a pre-recorded episode of “Your Financial Choices” with Laurie Siebert. Questions submitted via yourfinancialchoices.com will be addressed during the next live broadcast.
 THE NUMBERS
The Sources: Index Returns: Morningstar Workstation. Past performance is no guarantee of future results. Indices are unmanaged and cannot be invested into directly. Three, five and ten year returns are annualized. Interest Rates: Federal Reserve, Mortgage Bankers Association.
MARKET HEAT MAP
The health of the economy is a key driver of long-term returns in the stock market. Below, we assess the key economic conditions that we believe are of particular importance to investors.
|
US ECONOMY |
||
|
CONSUMER HEALTH |
NEUTRAL |
Q1 2022 Real GDP shrunk at a 1.5% annual rate according to the second estimate. This is the first contraction since the beginning of the pandemic. The main factors that resulted in a decrease in GDP were a surge in imports and trade deficit highlighting that the U.S. is buying more goods from foreign countries. This may be an indication that the U.S. economy has recovered faster than other countries. |
|
CORPORATE EARNINGS |
NEUTRAL |
The earnings growth rate for Q1 2022 was 9.2% — the lowest since Q4 2020 (3.8%). This estimate was revised upward from the previous forecast of 7.1% in April. All S&P500 companies have reported earnings — 77% reported a positive EPS surprise and 73% beat revenue expectations. The estimated growth rate for Q2 2022 is now 4.3% which would mark a new post-pandemic low. |
|
EMPLOYMENT |
POSITIVE |
Total nonfarm payroll employment rose by 390,000 in May and the unemployment rate remained constant at 3.6%. Job growth was widespread, led by gains in leisure and hospitality, manufacturing, and transportation and warehousing. Employment in retail trade declined. |
|
INFLATION |
NEGATIVE |
CPI rose 8.6% year-over-year in May2022, the largest increase since December 1981. Core CPI recorded a 6.0% increase (down slightly from April). The increase in CPI was driven by energy, food, and shelter. After declining in April, energy increased by 3.9% over May and gasoline rose by 4.1%. |
|
FISCAL POLICY |
NEUTRAL |
After passing a $13.6 billion package to support Ukraine a few weeks ago, the House approved an additional $40 billion military and humanitarian package for Ukraine. The bill was passed with 368 votes against 57 votes. The total of the two packages ($53 billion) is the largest foreign aid moved through Congress in over 20 years. |
|
MONETARY POLICY |
NEUTRAL |
The Fed responded to the persistent inflation numbers by raising rates by 75 basis points, the highest hike since November 1994. Powell mentioned that another 50 to 75 bps hike is likely for July. The next decisions by the Fed will be data-driven based on future inflation numbers and estimated economic growth. |
|
GLOBAL CONSIDERATIONS |
||
|
GEOPOLITICAL RISKS |
NEGATIVE |
Russia has defaulted on its debt as of Sunday, June 26th when the 30-day grace period on $100 million of interest payments expired. This is the first Russian default since 1918. Sanctions imposed by Western powers effectively isolated Russia and its financial system from Europe and the U.S. making it much harder for Russia to complete international financial transactions. |
|
ECONOMIC RISKS |
NEUTRAL |
Supply chain disruptions in the U.S. are waning but the rising cost of oil due to the Russian- Ukraine war is likely to cause additional inflationary pressures not only on gasoline prices but also on many other goods and services. Starting in June, China has started to remove some restrictions in major cities to end the COVID-19 lockdown. |
The “Heat Map” is a subjective analysis based upon metrics that VNFA’s investment committee believes are important to financial markets and the economy. The “Heat Map” is designed for informational purposes only and is not intended for use as a basis for investment decisions.
Need to check the status of a refund?
Fed = https://sa.www4.irs.gov/irfof/lang/en/irfofgetstatus.jsp
PA = https://www.doreservices.state.pa.us/Individual/RefundDefault.htm
NJ = https://www.state.nj.us/treasury/taxation/checkrefundstatus.shtml
by William Henderson, Vice President / Head of Investments
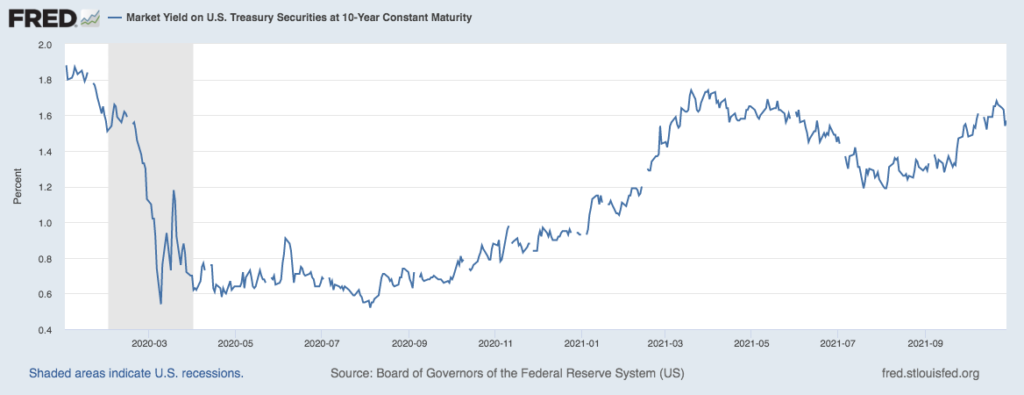
The day, the week, the month; each ended higher as last week posted strong gains for the markets, ending the strongest monthly performance since November of 2020. Last week, the Dow Jones Industrial Average rose +0.4%, the S&P 500 Index increased by +1.3% and the NASDAQ moved higher by +2.7%. Year-to-date, the Dow Jones Industrial Average has returned +18.8, the S&P 500 Index +24.0% and the NASDAQ +20.9%. The stock market seems to be reacting to future growth expectations in earnings even in the face of missed EPS releases. The bond market saw falling yields last week as fixed income investors shook off FED tapering fears and higher interest rates in 2020 and moved bond prices higher. The 10-year U.S Treasury closed the week at 1.57% down eight basis points from the previous week and well below the 1.74% level reached in March of this year. See the chart below of the 10-year U.S. Treasury from the Federal Reserve Bank of St. Louis dating to just before the Pandemic. Even at this level (1.57%), bonds offer investors an anchor for their portfolios while providing a needed risk management tool.
While the markets moved higher last week, three bellwether stocks, Apple, Amazon, and Starbucks released Q3 earnings and all surprisingly missed analysts’ expectations. The common themes mentioned in their earnings announcements were supply chain disruptions, labor shortages and inflationary pressures. Recognize that a miss on analysts’ expectations does not mean the companies did not grow their profitability year-over-year; on the contrary, each reported strong earnings growth, just not as strong as Wall Street analysts had expected. As we have mentioned many times, the markets are efficient and can see past short-term disappointments, however, the common problems (supply chain, labor, inflation) eventually will no longer be acceptable as “surprise” reasons for EPS misses. That said, successful companies will need to react and overcome in the new normal.
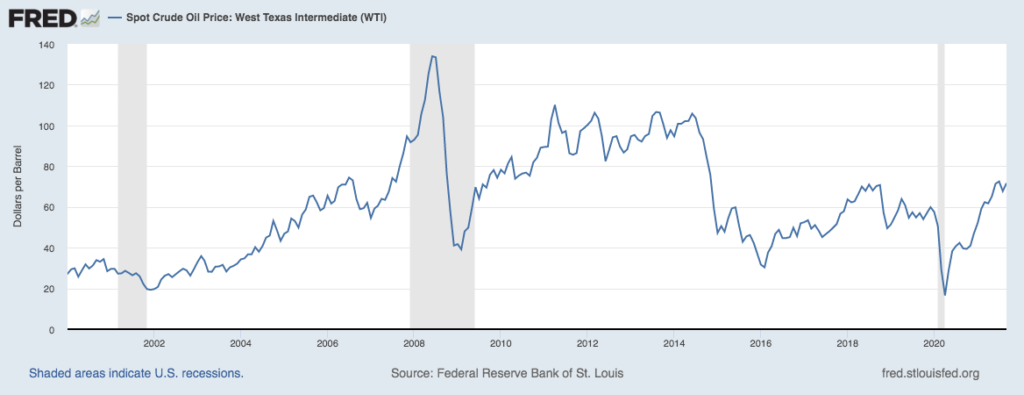
Meanwhile, other companies are enjoying the inflationary pressures we are seeing in crude oil prices. See the chart below from the Federal Reserve Bank of St. Louis on the spot price of West Texas Intermediate (WTI sweet crude oil). While well below levels seen before the Great Financial Crisis of 2008-09, WTI hit $72/barrel last week, well above the pandemic lows of $16/barrel. Last week, citing higher oil prices as the reason, Dow component Chevron announced Q3 earnings of $2.96/share, its highest level since Q1 2013.
We are optimists at VNFA and believe that firms will adapt and innovate as they have done for centuries. Further, technology will continue to be the driving force behind economic growth and continued improvement in production efficiencies. However, analysts are naturally predicting slower growth in 2022 as fiscal and monetary stimulus is gradually removed from the economy. While the pandemic is fading and vaccinations are now reaching most parts of the world, the post-pandemic impacts are still being felt everywhere. Supply-chain bottlenecks are real, and companies are dealing with shortages of all raw materials, as a result. “Help Wanted” signs are posted everywhere from McDonalds to Amazon to JP Morgan and the labor shortage is going to impact inflation more so than supply-chain disruptions and material shortages. Lastly, as engineered by central banks around the world, we will see inflation continue well into 2022. Higher inflation and full employment will be the recipe for higher interest rates next year. Markets are efficient and companies will need to be efficient too if they expect to perform as solidly in 2022 as they did in 2021. Watch for strong holiday shopping this year and healthy retail sales as the “wealthy” consumer gets freed from COVID-variants and begins to spend again.
by William Henderson, Vice President / Head of Investments
Equities notched yet another win last week with each of the major market indexes adding gains to already strong year-to-date returns. The Dow Jones Industrial Average rose +1.1%, the S&P 500 Index increased by +1.6% and the NASDAQ moved higher by +1.3%. Year-to-date, the Dow Jones Industrial Average has returned +18.3, the S&P 500 Index +22.4% and the NASDAQ +17.7%. Bond yields continued their slow rise recognizing that Fed tapering of bond purchases and higher short-term rates could happen sooner rather than later as the economic recovery from the pandemic continues in force. The 10-year U.S Treasury closed the week at 1.65%, up four basis points from the previous week and only slightly below the 1.74% level reached in March of this year.
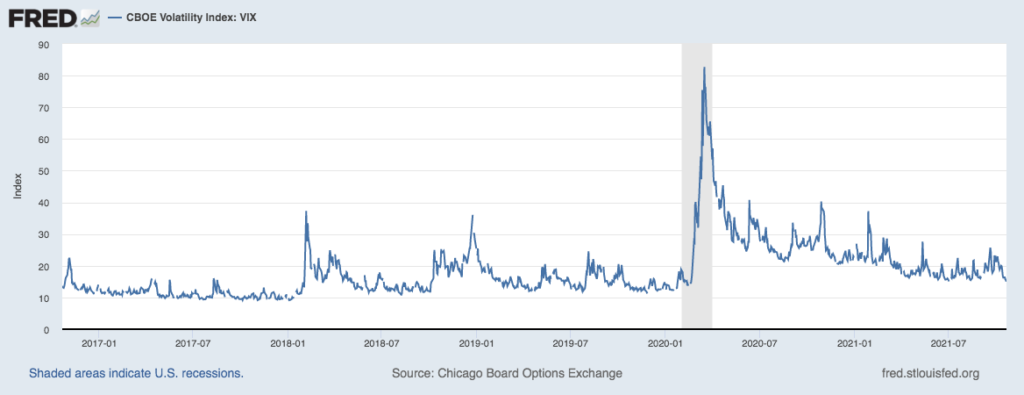
Comments from Federal Reserve Chair Jerome Powell late last Friday afternoon seemed to temper the bond market a bit. He stated that the U.S. Central Bank was on track to begin reducing asset purchases soon; however, he added that it is not yet time to raise interest rates because employment levels are still too low. Lastly, he added that inflation is likely to ease next year as pandemic-related pressures fade and supply chain disruptions settle. Powell’s comments cooled the bond market and helped to heat up the stock market and temper risk levels. The Chicago Board of Exchange Volatility Index (VIX) fell to its lowest level in more than four months. The VIX measures investors’ expectations of short-term market volatility. See the chart below of the VIX from the Federal Reserve Bank of St. Louis.
This week we will see two important measures of the strength of the economic recovery: Continued 3rd quarter corporate earnings releases and the U.S. government’s initial estimate of third quarter GDP growth. Earnings announcements thus far have bested Wall Street Analysts’ expectations so watch for this pattern to continue, which would bode well for the stock market. Conversely a miss by a major technology firm would put negative pressure on equity prices. The third quarter GDP growth report will give us a clearer picture of the negative impacts of the delta variant and oft talked about supply chain disruptions. Recall the second quarter GDP rose at a healthy 6.7% annual rate.
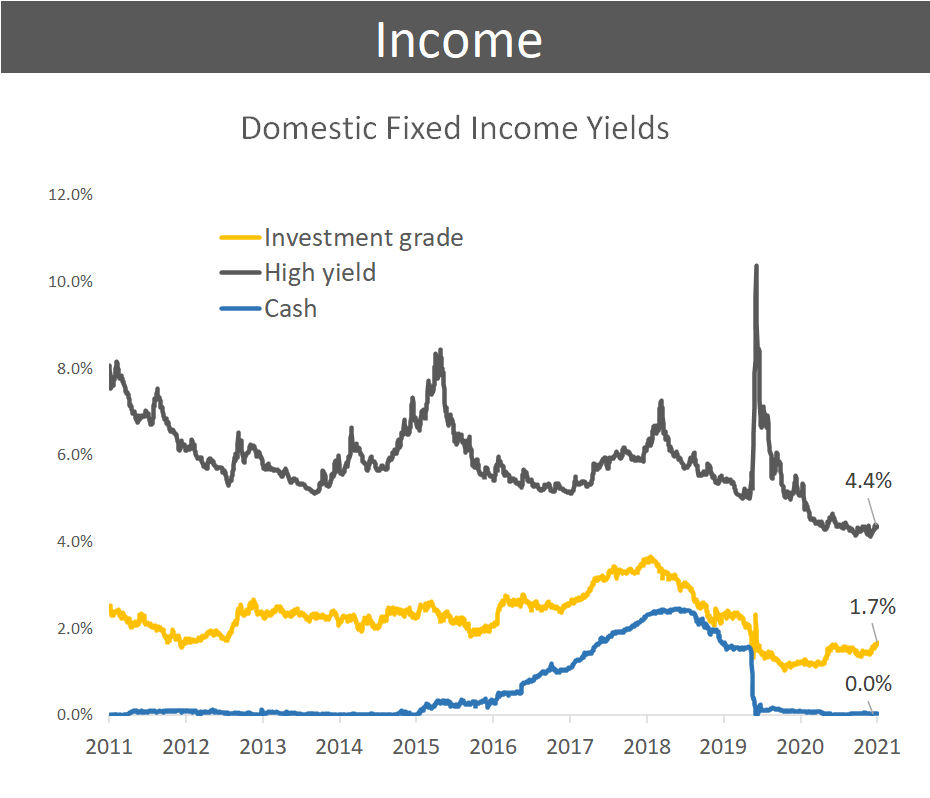
It is important to recognize that as bond yields rise, their relative attractiveness as an investment also rises. The 10-year U.S. Treasury at 1.65% yield offers substantially higher returns than parking money in cash which is effectively paying 0.00%. Further, while not offering stellar yields, fixed income investments also provide ballast to a balanced portfolio in times of market turmoil. See the chart below from Factset showing Domestic Fixed Income Yields.
Certainly, rising bond yields are generally bad news for bond prices because prices move inversely to yields. The current projections for yields as predicted by the FOMC (Federal Open Market Committee) shows short-term rates peaking around 3.00% in this current cycle and the 10-year U.S. Treasury peaking nearer to 2.50%. See the chart below from Bloomberg showing Fed policymakers predictions for short-term rates and the 10-year Treasury yield.
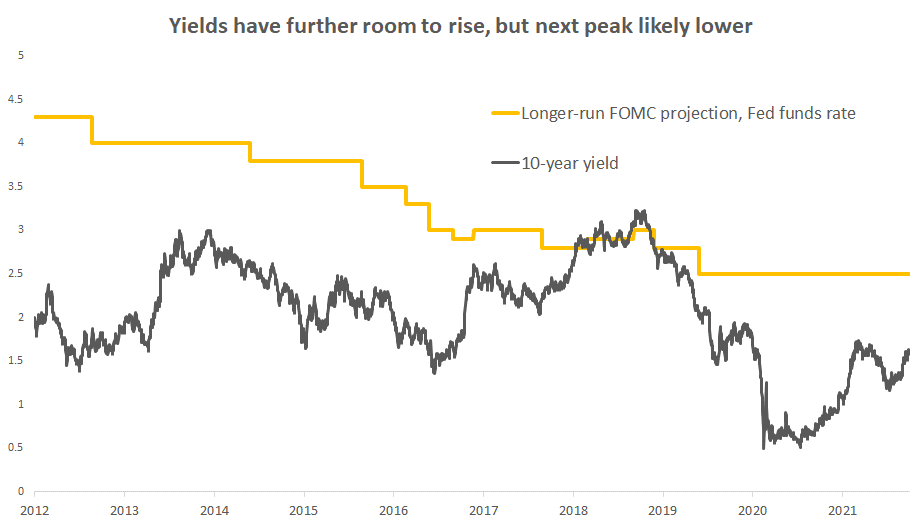
Recall also that while low by historical standards, U.S. bond yields are higher than most developed countries and there is still $11 trillion of negative-yielding debt globally. Global demand for U.S. Treasuries will likely remain strong for some time which will keep a virtual cover on a significant rise in domestic rates. We have pointed out for many weeks that the markets are indeed more efficient than investors ever believe. This is witnessed by the fact that it continues to climb the ever-present “Wall of Worries,” which includes: COVID-19 variants, inflation, Fed Tapering, supply chain disruptions and concerns about China. As we move into the fourth quarter, the consumer, flush with cash and sitting on a clean balance sheet will take over as the engine of economic growth. Analysts are already predicting a stunning increase of 15% or more in holiday spending this season and remember, domestic consumption makes up about 70% of the U.S. economy.