Team VNFA invites you to be part of our Holiday Hope Chest donations. November is upon us and our team has made a commitment again to create 2020 Holiday Hope Chests.
The
Volunteer Center of the Lehigh Valley’s annual program gathers shoe boxes
filled with gifts for nonprofit organizations to distribute. This year, more
than 9,000 boxes were requested from agencies across the Lehigh Valley. Learn
more at volunteerlv.org/holiday-hope-chests
Although our offices remain closed for the safety of
our clients and staff, we will be accepting appointments for drop off of items,
if our neighbors and friends wish to donate gifts or complete shoe boxes. Contact
our team with questions, to learn about the suggested gift list or to arrange
an appointment for delivery in November. Thank you!
by William
Henderson, Vice President / Head of Investments That was quite a week. All three major market indices were
down last week with the Dow Jones Industrial Average down -6.5% Standard &
Poor’s 500 Index down – 5.6% and the NASDAQ down -5.5%. Technology led the
averages lower even after four powerhouse firms beat earnings estimates: Apple,
Amazon, Facebook and Google all topped analyst’s estimates but they also
collectively spoke of lower guidance on revenues and slower growth going
forward. Another piece of positive news that failed to give the markets a
boost was the release of the 3rd Quarter year-over-year U.S. GDP at an
astounding 32%. Offsetting the positives were across the board and around the
world spikes in COVID-19 cases. Of course, we have the Presidential
Election ending Tuesday evening. Finally, we will put to rest one of our
unknowns for 2020.
Equity markets have been whipsawed this
year, first staging the fastest the bear market on record in March before
rallying to a staging a rebound not seen in 90 years. We have seen this
volatility previously. Large swings were also a common feature of the 2008
financial crisis. In 2008, there were 42 trading days where the S&P 500
moved by more than 3%. So far in 2020, there have been 28 days where the
S&P 500 has swung by 3% or more. Clearly, our collective unknowns that
we frequently cite, continue to roil the markets.
The housing market continues to boom; and, by most measures, activity in the housing sector is running at its highest level since 2007. Thankfully, this is a rebound from Spring, when COVID-19 lockdowns all but halted activity in the sector. Record-low mortgage rates, demographic tailwinds, and a general movement out of urban locales into suburban regions continue to fuel the boom. The housing boom fuels related sector growth as well such as landscaping, appliances, carpentry, plumbing and HVAC, and household electronics. A strong housing market is an excellent base for a continued economic recovery into 2021 and beyond.
With the markets being down so much last week, it is difficult to believe there are green shoots in our economy; however, looking at the fiscal and monetary stimulus alone, things are firmly in place for an economic rebound. Add to this any possibility of a COVID-19 vaccine in 2021 and the economy could see dramatic growth as the power of the consumer will finally be unleashed. The election will decide the next President of the United States, but one person remains in office continuing to be extremely important to the financial markets – Jerome Powell. Mr. Powell is committed to keeping rates low for a long time. Low rates are fueling the housing boom (as mentioned above) allowing healthy firms to borrow at record-low levels, thereby improving their balance sheets and reducing the net interest expense of the federal debt.
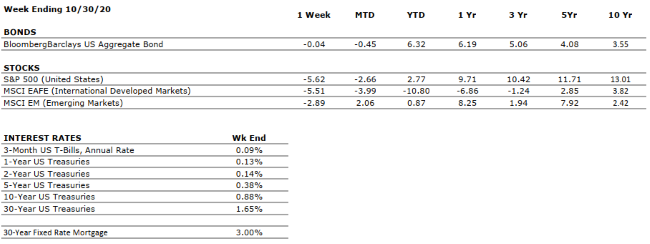
Sources: Index Returns: Morningstar Workstation. Past performance is no guarantee of future results. Indices are unmanaged and cannot be invested into directly. Three, five and ten year returns are annualized. Interest Rates: Federal Reserve, Mortgage Bankers Association.
MARKET HEAT MAP
The health of the economy is a key driver of long-term returns in the stock market. Below, we assess the key economic conditions that we believe are of particular importance to investors.
US ECONOMY
CONSUMER HEALTH
NEGATIVE
GDP increased at a 33.1% annualized pace in Q3. The U.S. economy has now recovered about 2/3 of its lost output owed to the COVID-19 pandemic.
CORPORATE EARNINGS
VERY NEGATIVE
S&P 500 earnings fell by around 1/3 in Q2, the sharpest year-over-year decline since 2008. Q3 earnings season, which is just beginning, is expected to show strong improvement over Q2.
EMPLOYMENT
VERY NEGATIVE
The unemployment rate declined to 7.9% in September, from a peak of 14.7% in April. While the rebound is material, the jobless rate remains well above the historical average.
INFLATION
POSITIVE
The Fed plans to allow inflation to temporarily overshoot its 2% target such that the long-term average is 2%. Inflation has been tame since the Great Financial Crisis, less than 2%.
FISCAL POLICY
VERY POSITIVE
A second major pandemic stimulus bill is likely to be passed after the Presidential Election.
MONETARY POLICY
VERY POSITIVE
The Federal Reserve has supported asset markets with unprecedented speed and magnitude in response to COVID-19.
GLOBAL CONSIDERATIONS
GEOPOLITICAL RISKS
VERY NEGATIVE
The relationship between the US and China, the world’s two largest economies, was already weakened by the trade war but has deteriorated further as a result of COVID-19.
ECONOMIC RISKS
VERY NEGATIVE
The impacts from COVID-19 were as swift and pronounced as any shock in modern times. Robust monetary and fiscal stimulus stabilized the system; however, economic activity remains well- below that in 2019, and uncertainty remains high, particularly with the election just eight days away.
The “Heat Map” is a subjective analysis based upon metrics that VNFA’s investment committee believes are important to financial markets and the economy. The “Heat Map” is designed for informational purposes only and is not intended for use as a basis for investment decisions.
Team Chat – Trending Topics (October 2020)
Financial Advisors Joseph Goldfeder, CFP® and Jaclyn Cornelius, CFP®, EA discuss some planning topics that are top of mind currently in their work with clients. WATCH NOW
Laurie can take your questions live on the air at 610-758-8810, or address those submitted via yourfinancialchoices.com. Recordings of past shows are available to listen or download at both yourfinancialchoices.com and wdiy.org.