Only two days
left before the Volunteer Challenge. The live virtual event will include an
interactive panel, musical guest, a special “Golden Ticket” raffle, and of
course final opportunities to vote for projects. Team VNFA, as of Monday
morning, was leading the votes but only by a small margin. Every vote is a
contribution in support of the Volunteer Center of the Lehigh Valley. You can register for free to
watch on May 20 at 5 p.m., and you can learn about and vote for the 20+
community impact projects completed this year at volunteerlv.org/vote.
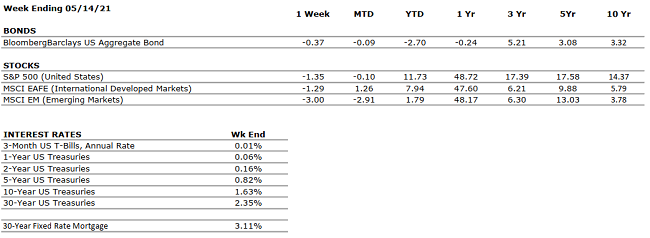
by William Henderson, Vice President / Head of Investments Last week, the markets moved lower from their previous record highs as investors reacted negatively to signs of higher inflation evident in the release of core inflation data. For the week that ended May 14, 2021, the Dow Jones Industrial Average returned -1.1%, the S&P 500 Index fell by -1.4% and the NASDAQ fell by -2.3%. U.S. Treasury bond yields rose as a result of the news. The 10-year U.S. Treasury Bond rose five basis points to close the week at 1.63%. Even considering last week’s losses in the markets, year-to-date returns remain positive. The Dow Jones Industrial Average has returned +13.1%, the S&P 500 Index +11.7% and the NASDAQ +4.5%.
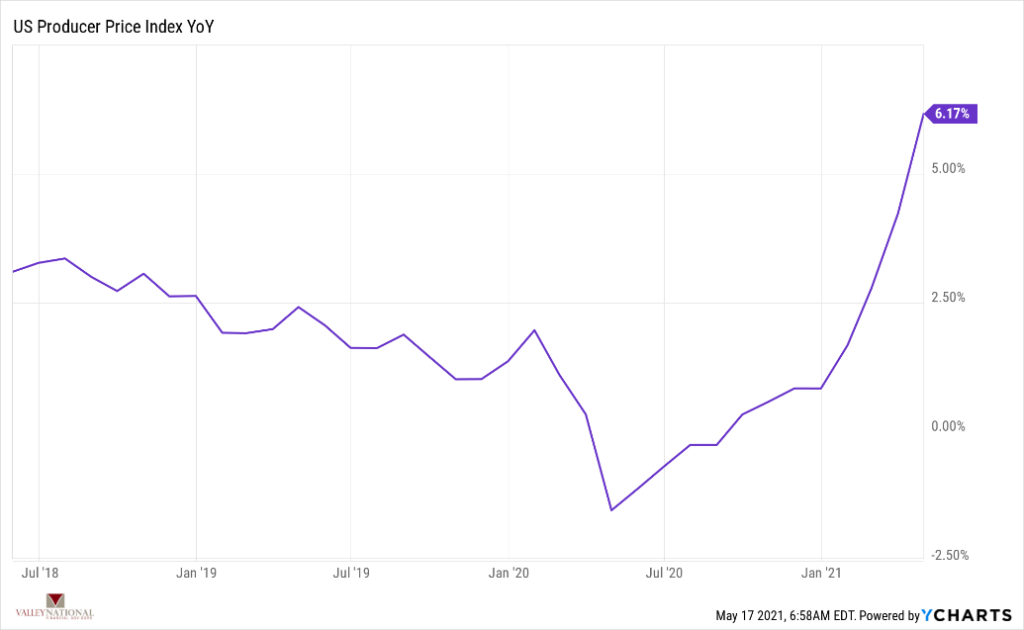
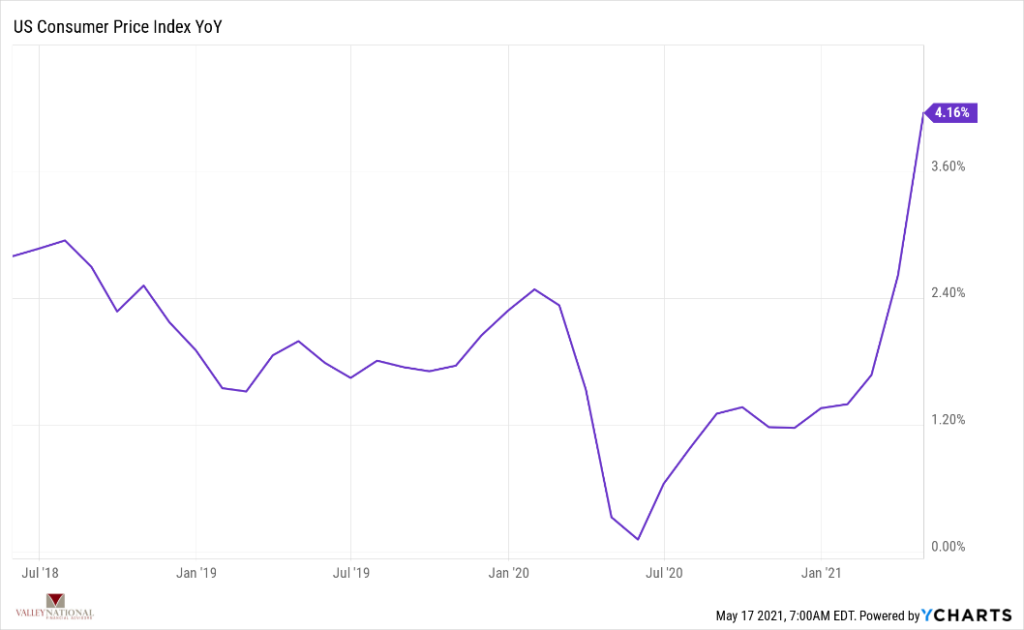
As mentioned, the inflation
data released last week cast a pall over the
markets. Two generally accepted measures of inflation were released, and
both saw substantial increases. The April
2021, year-over-year change in CPI (Consumer
Price Index) jumped +4.2% while PPI (Producer
Price Index) popped +6.2%. CPI
is the average change in prices consumer
pay for all goods; PPI
is the average change in prices received by domestic producers for their output. (See
two charts below from Y-Charts).
While this inflation data was much
larger than economists predicted, it does not point to doom and gloom for the
economy or the markets. Remember, the Fed (Federal
Reserve Bank), is
looking for inflation. Last week,
Fed Vice Chair Richard Clarida acknowledged
the surprise data by stating, “this data is entirely consistent with
the Fed’s goals.” Additional comments from the Fed reminded investors that
the economy remains far from the
Fed’s employment goals. Recall, the Fed’s objective
is to seek full employment and control inflation. For years, inflation has
been running well below their stated objective of 2% per year and
unemployment remains above 6%. So, the Fed has been clear about keeping
interest rates lower for longer – at least until
both inflation and employment are in check.
Beyond inflation worries,
investors were also forced to digest other
unsettling events, including a hacker-induced shutdown of a major gasoline
pipeline operated by Colonial
Pipeline, the primary supplier of gas to the Southeast. Further, shortages
in microchips have hampered car production in the
U.S. which has oddly led to
a rental car shortage. Lastly, and
not unexpectedly, there was a sell-off in cryptocurrencies,
specifically Bitcoin, as tech wizard Elon Musk announced that Tesla would
no longer accept Bitcoin as payment for its cars because of the large carbon
footprint that
cryptocurrency mining leaves behind.
There was plenty of good news
last week as well. The CDC announced an easing of mask wearing
requirements for fully
vaccinated people and vaccine
distribution for COVID-19 could begin for children aged 12-15. We
have finally, hopefully, turned the corner on the pandemic and a grand
reopening is upon us. A consumer flush with cash and willing Fed should
provide the continued stimulus the economy and the markets need
to move forward.
THE NUMBERS Sources: Index Returns: Morningstar Workstation. Past performance is no guarantee of future results. Indices are unmanaged and cannot be invested into directly. Three, five and ten year returns are annualized. Interest Rates: Federal Reserve, Mortgage Bankers Association.
MARKET HEAT MAP
The health of the economy is a key driver of long-term returns in the stock market. Below, we assess the key economic conditions that we believe are of particular importance to investors.
US ECONOMY
CONSUMER HEALTH
POSITIVE
The economy expanded at a 6.4% annualized pace in Q1. At the current rate, U.S. GDP will return to pre-COVID levels by midyear.
CORPORATE EARNINGS
POSITIVE
S&P 500 Q1 sales and earnings growth have come in at 9% and 45%, respectively, representing extremely strong results.
EMPLOYMENT
POSITIVE
The unemployment rate increased to 6.1% in April, from 6% in March.
INFLATION
POSITIVE
Inflation was 4.5% in April. The Fed plans to allow inflation to temporarily overshoot its 2% target such that the long-term average is 2%. Inflation has generally been tame since the Great Financial Crisis, less than 2%.
FISCAL POLICY
POSITIVE
President Biden recently unveiled a stimulus package directed towards infrastructure that would total more than $2 trillion over eight years. President Biden is also considering a significant capital gains tax increase.
MONETARY POLICY
VERY POSITIVE
The Federal Reserve continues to indicate that the monetary environment will remain very accommodative for the foreseeable future.
GLOBAL CONSIDERATIONS
GEOPOLITICAL RISKS
NEUTRAL
There are few, if any, looming geopolitical risks that could upset the economic recovery.
ECONOMIC RISKS
NEUTRAL
With multiple vaccines in distribution and highly accommodative fiscal and monetary policies in place, 2021 may be one of the strongest economic years on record.
The “Heat Map” is a subjective analysis based upon metrics that VNFA’s investment committee believes are important to financial markets and the economy. The “Heat Map” is designed for informational purposes only and is not intended for use as a basis for investment decisions.