In observance of the Memorial Day holiday our offices will be closed on Monday, September 6.
Monthly Archives: August 2021
Current Market Observations
by William Henderson, Vice President / Head of Investments
Fed Chairman Jay Powell gave the markets what they expected during his virtual Jackson Hole speech. He offered calming words around the effect of modest tapering of bond purchases by year-end and no rate hikes until unemployment is at or near the 4.5% target and average inflation hits 2%. Those few words gave solace to the markets and we saw a nice rally at the end of the week. Last week, the Dow Jones Industrial Average gained +1%, the S&P 500 Index gained +1.5% and the tech-heavy NASDAQ gained a juicy +2.8%. Strong weekly gains added to already strong year-to-date gains, shaping 2021 into quite a year for stock market returns. Year-to-date, the Dow Jones Industrial Average has returned +17.3%, the S&P 500 Index +21.2% and the NASDAQ +17.9%. The Fed’s dovish tone during Powell’s speech kept Treasury Bonds from drastically selling off on the bond tapering news. The yield on the 10-year U.S. Treasury rose five basis points to 1.31% from 1.26% the previous week. The current rate is 43 basis points lower than the 1.74% yield level hit in March of this year.
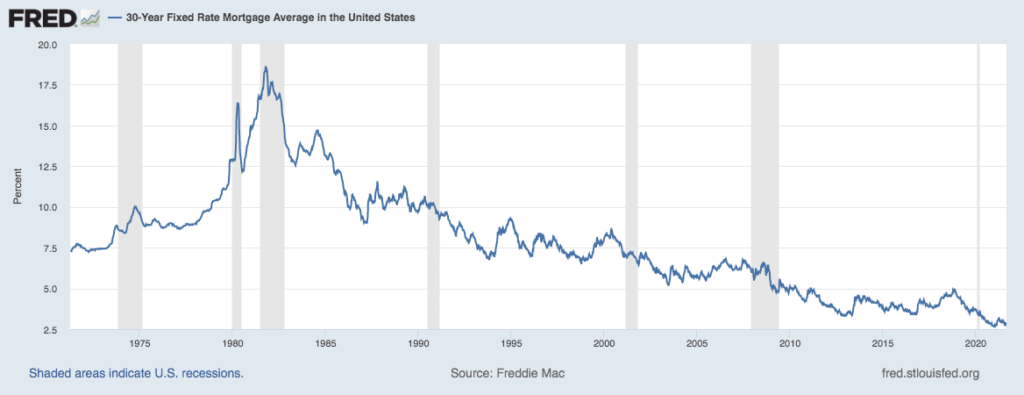
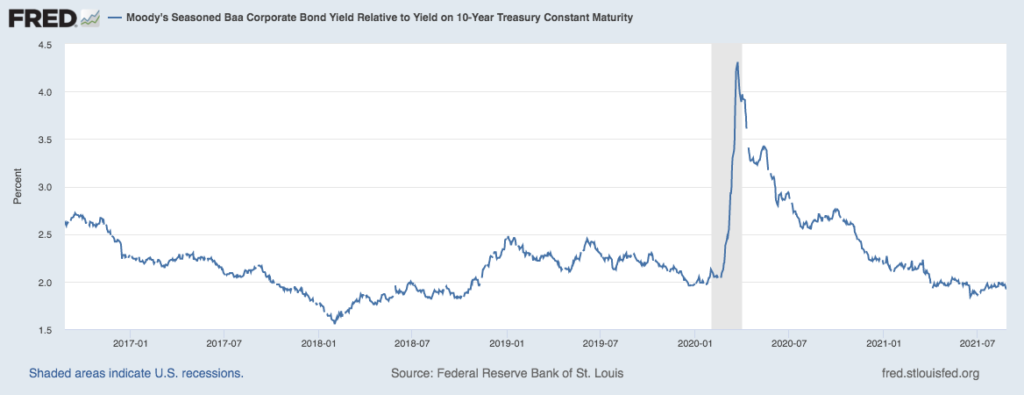
Low Treasury Bond yields impact corporate borrowing levels and mortgage rates, both of which have positive implications on the overall economy. Corporations can borrow at historically low levels and low mortgage rates also continue to boost the U.S. housing market. (See the two charts below, both from the Federal Reserve Bank of St. Louis). The first chart shows the 30-year fixed rate mortgage average in the United States and the second, by Moody’s, shows corporate bond yields relative to the 10-year Treasury (commonly called the “spread” to treasuries). Both charts are at or near record low levels.
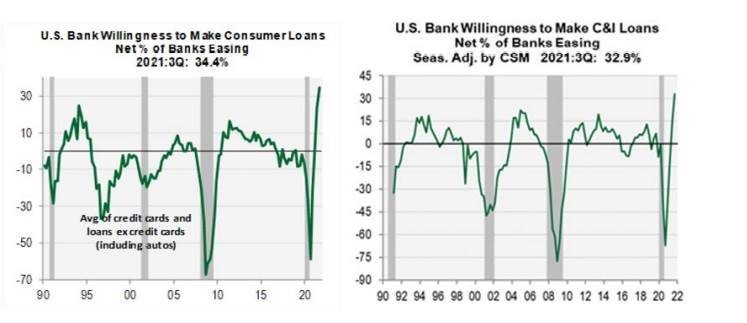
Several issues remain solidly behind the markets and the economy. First, as we have shown many times, the consumer is flush with cash (from stimulus money, decreased spending over the past year and increased savings). Second, the banking system is in great shape to fuel an already expanding economy. Two charts by Cornerstone Macro show U.S. banks willingness to make consumer loans and Commercial and Industrial Loans (C&I) at or near record levels in both cases. Low rates and banks’ strong willingness to lend make a good partnership.
And third, as mentioned above, Treasury yields remain low, allowing mortgage rates to stay low and corporations to borrow at near record low levels. All three issues point to the continuation of a healthy growing economy and a strong finish to 2021.
It would not be prudent to speak only in terms of positive indicators. Truthfully, each week we scour the headlines searching for headwinds and pockets of negativity. Concerns about unrest in Afghanistan and elsewhere across the globe, supply chain disruptions, and uncertainty around COVID-19 variants seem to always be bubbling just under the surface. Remember, every healthy bull market has frequent selloffs (sometimes by 5% or more), so it is important to realize that markets go down and markets go up; we just hope that in the end, there are more ups than downs. Like a broken record going around a turntable (are we dating ourselves?), we repeat: a long-term outlook and sound financial plan is a solid recipe for success. Pay attention to what’s behind the growth story and the solid economic foundation the Fed has built.
The Numbers & “Heat Map”
THE NUMBERS
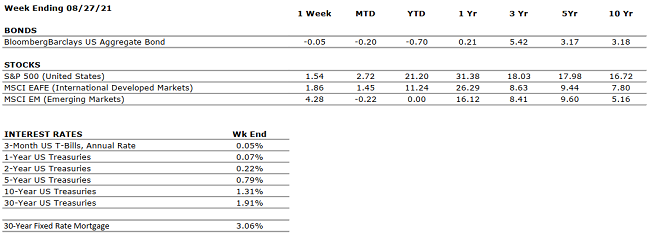 Sources: Index Returns: Morningstar Workstation. Past performance is no guarantee of future results. Indices are unmanaged and cannot be invested into directly. Three, five and ten year returns are annualized. Interest Rates: Federal Reserve, Mortgage Bankers Association.
MARKET HEAT MAP
The health of the economy is a key driver of long-term returns in the stock market. Below, we assess the key economic conditions that we believe are of particular importance to investors.
|
US ECONOMY |
||
|
CONSUMER HEALTH |
POSITIVE |
July retail sales declined 1.1% vs. June 2021 but are 15.8% higher than July 2020. |
|
CORPORATE EARNINGS |
POSITIVE |
S&P 500 Q2 sales and earnings grew an astonishing 25% and 89%, respectively, when compared to the heavily depressed figures from Q2 2020. |
|
EMPLOYMENT |
POSITIVE |
In July, the U.S. economy added 943,000 jobs, bringing the unemployment rate down to 5.4%. |
|
INFLATION |
NEUTRAL |
Inflation remained at 5.4% year-over-year in July, the same reading as in June. Fed Chairman Jay Powell believes that the high inflation is transitory and will decelerate as global supply chain bottlenecks resolve. |
|
FISCAL POLICY |
POSITIVE |
The Senate passed a $1 trillion infrastructure package. The bill is expected to be voted on by The House by the end of this year. |
|
MONETARY POLICY |
POSITIVE |
The Federal Reserve has indicated that it does not plan to increase interest rates until 2023. |
|
GLOBAL CONSIDERATIONS |
||
|
GEOPOLITICAL RISKS |
NEGATIVE |
The Taliban’s control in Afghanistan is causing uncertainty and unrest around the globe. |
|
ECONOMIC RISKS |
NEUTRAL |
With multiple vaccines in distribution and accommodative fiscal and monetary policies in place, 2021 is shaping up as one of the strongest economic years on record. The primary risk at present is that of persistent inflation which begets higher interest rates. |
The “Heat Map” is a subjective analysis based upon metrics that VNFA’s investment committee believes are important to financial markets and the economy. The “Heat Map” is designed for informational purposes only and is not intended for use as a basis for investment decisions.
Quote of the Week
“Our debt to the heroic men and valiant women in the service of our country can never be repaid. They have earned our undying gratitude. American will never forget their sacrifices.” – President Harry S. Truman
“Your Financial Choices”
“Your Financial Choices” on WDIY 88.1FM will be hosted this week by Rodman Young and Jaclyn Cornelius from Valley National Financial Advisors. Rod and Jackie will discuss: Retiring Early. Tune in or listen online Wednesday from 6-7p.m.
Recordings of past shows are available to listen or download at both yourfinancialchoices.com and wdiy.org.
VNFA NEWS
Happy Birthday to #TeamVNFA! In August 1985 Tom Riddle established the firm and laid out his mission to help clients make the right financial choices in pursuit of their lifelong goals and dreams. So, we are celebrating 36 years of one-stop financial planning and wealth management based right here in the Lehigh Valley.

Did You Know…?
VIDEO: Saving for College 101
Saving for college can be a daunting task, but with some wise planning, one can be better prepared for the future. There are several great ways to save up. Step into our classroom and let’s review your choices. WATCH NOW

Current Market Observations
by William
Henderson, Vice President / Head of Investments
U.S. stocks
finished last week modestly down across the board. The
Dow Jones Industrial Average fell -1.1%, the
S&P 500 Index lost -0.6%,
and the NASDAQ fell by
-0.7%. The
modest losses for the week did not take much from full
year 2021 returns, which remain healthy across
all three indexes. Year-to-date,
the Dow Jones Industrial Average has returned +16.1%,
the S&P 500 Index +19.4% and the
NASDAQ +14.7%. Treasury
bonds changed very
little last
week with
the yield on the 10-year U.S. Treasury
dropping two basis
points to 1.26% from 1.28% the
previous week. 1.26% on the 10-year U.S.
Treasury is a full 48 basis points
lower than the 1.74% yield level hit in March of this year. Further,
traders and equity markets certainly
were caught off guard last week when
the FOMC meeting minutes were
released and showed that the Central Bank was considering a “tapering” of bond
purchases. This had
to have been an “Emperor Has No Clothes” moment as the worst kept secret on
Wall Street was revealed. Everyone, everywhere
expects the Fed to taper its bond purchases, so why did the markets
sell off?
As we planned this
week’s market commentary, it was agreed that we would not follow the herd and
mention the “Taper Tantrum of 2013,” however, it
seems we failed. This event refers to the 2013 modest sell off in bonds
resulting from the Fed announcement that it would finally reduce bond purchases
it had been making since 2008 because of the Great Financial Crisis. Looking
at the chart below from the Federal
Reserve Bank of St. Louis, the “event” of 2013 looks more like
a buying opportunity in bonds rather than a blood bath for bond traders as
the 10-year U.S. Treasury hit 3.04% at the end of 2013.
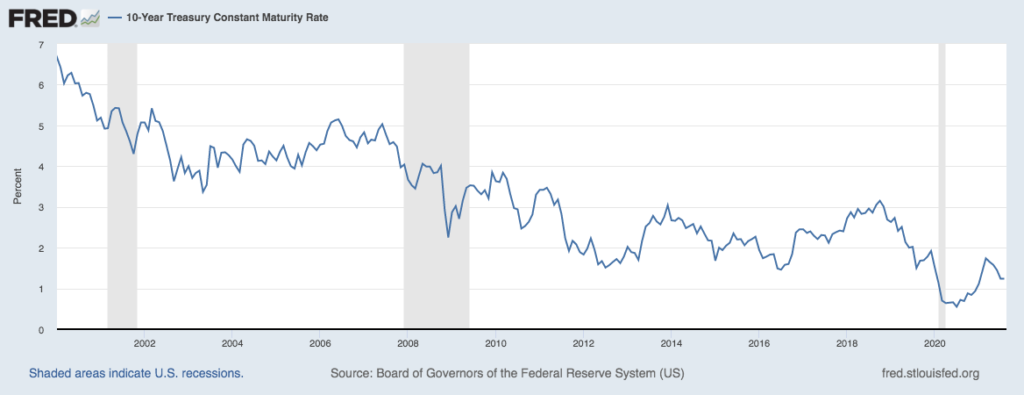
The point is that everyone knew in 2013 that the Fed needed to slow its bond purchases and allow the markets to return to somewhat normal trading patterns. Just like 2021 – everyone knows the Fed must slow its purchases. So, again, why did the markets sell off on last week’s news from the Fed meeting minutes? The markets are most likely seeing the gradual end to the massive monetary stimulus that the Fed has provided since March of 2020 and that simply removes a comfortable layer of protection and adds an unsettling layer of uncertainty.
There are two opposing thoughts: First, actions
by the Fed to reduce its
bond purchases thereby starting to remove monetary stimulus, shows the economy
is well on its way to a solid recovery. This is healthy news and should
eventually result in strong
market performance. Second and more worrisome
was the Fed’s last-minute change
to its annual symposium in Jackson Hole, Wyoming, to
a virtual event rather than the previously planned in
person event. The Fed’s decision to cancel
this live event is certainly indicative of wider
implications from the spiking in cases of delta-variant of COVID-19 and signs
of overall weakness in economic activity. Data
released from the Transportation Security Administration last Friday showed
a slowdown in travel, with the number of people passing through TSA checkpoints down
10% from a mid-July high. In our opinion, one could certainly brush off
this drop in travel as typical of the summer travel season ending and the “back
to school” season starting. Either way,
it is information and activity that the market must digest
and then react to in one way or another.
Just
like we need things to write about each week, so do the business news channels
needs things to talk about every day all day. Economic noise and
information are widely
available and overly celebrated. We like to focus on long-term trends like the 50-year growing
GDP of the United States, favorable demographic trends in the
U.S. compared to other developed countries, and finally, long-term performance
of stock and bond markets. Keep focused on your investment and ignore
the noise.
The Numbers & “Heat Map”
THE NUMBERS
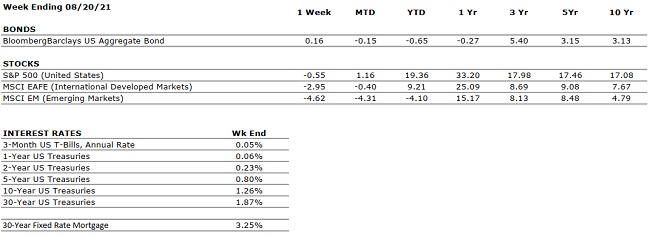 Sources: Index Returns: Morningstar Workstation. Past performance is no guarantee of future results. Indices are unmanaged and cannot be invested into directly. Three, five and ten year returns are annualized. Interest Rates: Federal Reserve, Mortgage Bankers Association.
MARKET HEAT MAP
The health of the economy is a key driver of long-term returns in the stock market. Below, we assess the key economic conditions that we believe are of particular importance to investors.
|
US ECONOMY |
||
|
CONSUMER HEALTH |
POSITIVE |
July retail sales declined 1.1% vs. June 2021 but are 15.8% higher than July 2020. |
|
CORPORATE EARNINGS |
POSITIVE |
With more than 90% of S&P 500 constituents having reported Q2 results, sales and earnings growth are running at an astonishing 25% and 89% pace when compared to the heavily depressed figures from Q2 2020. |
|
EMPLOYMENT |
POSITIVE |
In July, the U.S. economy added 943,000 jobs, bringing the unemployment rate down to 5.4%. |
|
INFLATION |
NEUTRAL |
Inflation remained at 5.4% year-over-year in July, the same reading as June. Fed Chairman Jay Powell believes that the high inflation is transitory and will decelerate as global supply chain bottlenecks resolve. |
|
FISCAL POLICY |
POSITIVE |
The Senate passed a $1 trillion infrastructure package. The bill is expected to be voted on by The House by the end of this year. |
|
MONETARY POLICY |
POSITIVE |
The Federal Reserve has indicated that it does not plan to increase interest rates until 2023. |
|
GLOBAL CONSIDERATIONS |
||
|
GEOPOLITICAL RISKS |
NEGATIVE |
The Taliban’s control in Afghanistan is causing uncertainty and unrest around the globe. |
|
ECONOMIC RISKS |
NEUTRAL |
With multiple vaccines in distribution and accommodative fiscal and monetary policies in place, 2021 is looking like one of the strongest economic years on record. The primary risk at present is that of persistent inflation which begets higher interest rates. |
The “Heat Map” is a subjective analysis based upon metrics that VNFA’s investment committee believes are important to financial markets and the economy. The “Heat Map” is designed for informational purposes only and is not intended for use as a basis for investment decisions.
Quote of the Week
“Do anything but let it produce joy.” – Walt Whitman
