
“The only competition worthy of a wise man is with himself.” – Washington Allston
Monthly Archives: February 2022
Did You Know…?
Cybersecurity is something Team VNFA takes very seriously. We participate in regular trainings to stay on top of the latest and to keep ourselves alert. Here are a few quick tips to protect your digital privacy at tax season and year-round:
- Implement multi-factor authentication on your accounts and make it 99% less likely you’ll get hacked.
- Update your software. In fact, turn on automatic updates.
- Think before you click. More than 90% of successful cyber-attacks start with a phishing e-mail.
- Use strong passwords, and ideally a password manager to general and store unique passwords.
The IRS provides regular updates to its resource page to help protect taxpayers: irs.gov/taxessecuritytogether
VIDEO: Help the IRS protect your identity
VIDEO: Find out how you can protect your phone and computer.
Tax Corner
2021 Tax Filing Q&A – visit our website for all the answers at valleynationalgroup.com/tax
REMINDER: If you are using your eVault Client Portal to upload tax source documents. Please put them together and upload one file or as few files as possible. When you are finished, e-mail our Tax Department at tax@valleynationalservices.com.
Current Market Observations
by William Henderson, Chief Investment Officer
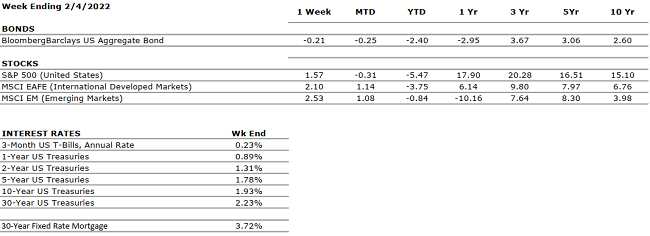
While year-to-date returns remain in the negative column for all three major market indexes, last week produced a positive week for patient and persistent investors. The Dow Jones Industrial Average rose +1.1%, the S&P 500 Index gained +1.6% and the NASDAQ, as the week’s bigger winner, gained +2.4%. As stated, year-to-date returns remain negative with the Dow Jones Industrial Average down –3.4%, the S&P 500 Index down –5.5% and the NASDAQ down -9.8%. Fixed income, as in Treasury Bonds, which normally provide investors relief when markets are selling off, have fared no better year-to-date. Last week, the yield on the 10-year U.S Treasury bond rose by 15 basis points to close the week at 1.93%.
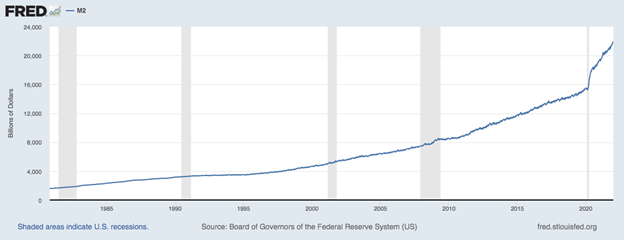
Our thesis each week is one centered around long-term investing that focuses on macro themes and avoids the noise presented by headline grabbing news sound bites and other hyperbolic tape bombs. We have focused on the solid fundamentals that backstop the U.S. economy including well capitalized and healthy banks, profitable and growing corporations and consumers that are sitting on $21.8 trillion (about $67,000 per person in the US) of cash with few “open” venues to spend their money. (See chart of M2 by the Federal Reserve Bank of St. Louis. M2 consists of savings deposits, balances in retail money market funds and small-denomination time deposits.)
These fundamental strengths in the U.S. economy have led to strong year over year GDP growth, near record low unemployment and near record levels on major stock market indexes. We point this out to remind investors of the importance of the relationship between a growing economy and a rising stock market. See the chart below from Valley National Financial Advisors and YCharts, which shows the S&P 500 Index with U.S. Total GDP from 1992 to the present.
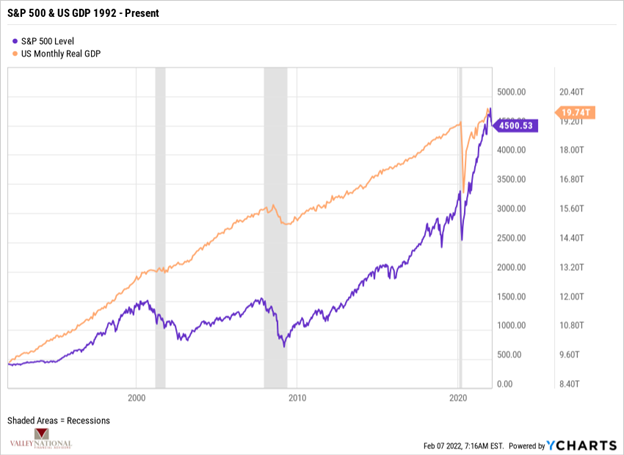
There is a clear correlation between GDP growth and the stock market, especially over extended periods of time. This commitment to long-term investment has rewarded the patient investor who sees the impact of macro themes on the markets. We have stated that pull-backs and market corrections happen all the time, and notably during bull markets. These occurrences are common and normal in functioning markets. So, while we have seen weak year-to-date returns on markets (-5.5% YTD on the S&P 500 Index) recall that the S&P 500 Index returned +26.9%, in 2021 and +16.3% in 2020 and has averaged +10.5% annually since its inception in 1926 (Investopedia). Long-term results are what matters to investors, not short-term returns, or short-term thinking.
Further, last Friday’s release of the latest monthly employment report sent another wave of good news. In January, 467,000 new jobs were created, which far exceeded Wall Street economists’ expectations of +125,000. The massive increase in new jobs was surprising especially given the headwinds that the omicron variant created. Particularly encouraging was the relative strength of job growth in the leisure and hospitality sectors which remain below pre-pandemic levels. Lastly, there was a sharp jump in the labor participation rate which moved to a post-pandemic high (see the chart below from FactSet and Edward Jones).
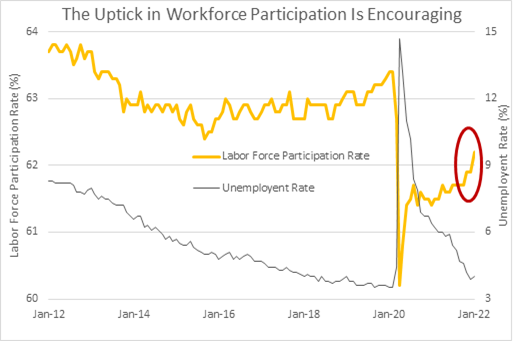
The labor force participation rate indicates the percentage of all people of working age who are employed or are actively seeking work. When factored in with the unemployment rate (currently at 4%), the participation rate offers perspective into the state of the economy, which we believe continues to exhibit strength and solid potential for greater growth well into 2023.
Certainly, last week’s jobs report puts the Federal Reserve in a quandary about interest rates and the speed and size of pending rate hikes. Everyone knows rate hikes by the Fed are coming in 2022 and into 2023. We pointed out last week that the stock market commonly moves higher, even during rate hikes and especially as rate hikes are known and already factored into most investors’ plans for 2022. We remain steadfast in our positive long-term outlook for the economy and the markets. Committed investors should do the same.
The Numbers & “Heat Map”
THE NUMBERS
 Sources: Index Returns: Morningstar Workstation. Past performance is no guarantee of future results. Indices are unmanaged and cannot be invested into directly. Three, five and ten year returns are annualized. Interest Rates: Federal Reserve, Mortgage Bankers Association.
MARKET HEAT MAP
The health of the economy is a key driver of long-term returns in the stock market. Below, we assess the key economic conditions that we believe are of particular importance to investors.
|
US ECONOMY |
||
|
CONSUMER HEALTH |
POSITIVE |
U.S. Real GDP growth for Q4 2021 increased at an annual rate of 6.9% compared to 2.3% in Q3 (according to advance estimate). The acceleration was driven primarily by private inventory investment. Real GDP increased by 5.7% in 2021 versus a decrease of -3.4% in 2020. Disposable income saw a slight increase of 0.3% and personal saving rate decreased to 7.4% in Q4 from the previous 9.5% in Q3 highlighting increased consumer spending. |
|
CORPORATE EARNINGS |
POSITIVE |
Fourth quarter wrapped up and earnings are likely to be impacted by labor, supply shortages, price increases and wage inflation. As EPS estimates are ironed out each of these items will play a role, some greater than others. Watch for increases but at a muted pace. |
|
EMPLOYMENT |
POSITIVE |
Although December increase in payrolls did not meet expectations (199,000 jobs added versus 422,000 expected), the unemployment rate fell to 3.9% versus an expected 4.1%. Wages increased more than expected at 4.7% year-over-year. Strong recovery in leisure and hospitality which had the biggest gain by industry and accounted for more than 25% of all jobs added in December (55,000). |
|
INFLATION |
NEGATIVE |
CPI rose 7% year-over-year in December 2021, the highest increase since 1982, driven by the global supply chain backlog and continued consumer pent up demand. Will inflation be transitory or permanent? Goldman Sachs capital market assumption forecast CPI at an average of 3.1% for 2022 suggesting a significant decrease in inflation from the current 7%. |
|
FISCAL POLICY |
NEUTRAL |
The Build Back Better Bill has been scaled back from $2.2 trillion to a $1.8 trillion version as Senator Manchin continues to hold back support. President Biden has mentioned the idea of breaking up the BBB Bill into smaller pieces to be able to pass fractions at a time. The economy seems to be digesting a new world where fiscal policy is no longer considered an economic stimulus. |
|
MONETARY POLICY |
NEUTRAL |
Fed discussed a triple threat of tightening: raise interest rates, halt purchases, and reduce its balance sheet (reducing holdings of Treasurys and mortgage-backed securities). Gradual and steady reduction of liquidity will be key in preserving market performance (fast and sudden changes would most likely result in panic-driven sell offs). Expect three rate hikes in 2022 beginning in March. |
|
GLOBAL CONSIDERATIONS |
||
|
GEOPOLITICAL RISKS |
NEUTRAL |
The omicron COVID-19 variant has shown up in many parts of the world. This strain seems less virulent and more reactive to boosters so its impact it still yet to be calculated. A rebound in travel and leisure now seems unsure. Important to watch the Russia/Ukraine situation. |
|
ECONOMIC RISKS |
NEUTRAL |
Supply chain disruptions are hampering the economy; however, demand remains very strong. While global logistics are operating far below normal efficacy, it appears the supply chain is slowly improving and may reach normalcy by mid-to-late-2022. |
The “Heat Map” is a subjective analysis based upon metrics that VNFA’s investment committee believes are important to financial markets and the economy. The “Heat Map” is designed for informational purposes only and is not intended for use as a basis for investment decisions.
Quote of the Week
“Success is built sequentially. It’s one thing at a time.” – Gary W. Keller
“Your Financial Choices”
Tune in Wednesday, 6 PM for “Your Financial Choices” with Laurie Siebert on WDIY 88.1FM. Laurie will discuss: Listener Tax Questions
Laurie can address questions on the air that are submitted either in advance or during the live show via yourfinancialchoices.com. Recordings of past shows are available to listen or download at both yourfinancialchoices.com and wdiy.org.
VNFA NEWS
We are pleased to announce the promotion of William Henderson to Chief Investment Officer.

Bill, who joined VNFA in August 2020 as Vice President and Head of Investment, came to Team VNFA after 30 years in the industry and 26 years at BlackRock, Inc.
Learn more about Bill on our website: William Henderson – Valley National Financial Advisors
He now leads VNFA’s Investment Department, chairs the internal Investment Committee, and directs all investment research efforts. He provides investment analysis and assists VNFA’s advisory teams with portfolio strategy and asset allocation direction. He meets frequently with representatives from global asset managers to discuss their views about the economy and financial markets, and he lends his own current market observations in VNFA’s The Weekly Commentary e-mail newsletter.
“Bill has been a positive force on our team from the start,” said Matt Petrozelli, VNFA CEO. “Under his leadership our Investment Department has evolved into an even more sophisticated and efficient part of our operations, adding tremendous value to the client experience.”
“I am very proud to be working at a firm like VNFA that put clients first,” said Henderson. “This team is a model example of a fiduciary standard where the culture is based on doing what is right for each client.”
Current Market Observations
by William Henderson, Chief Investment Officer
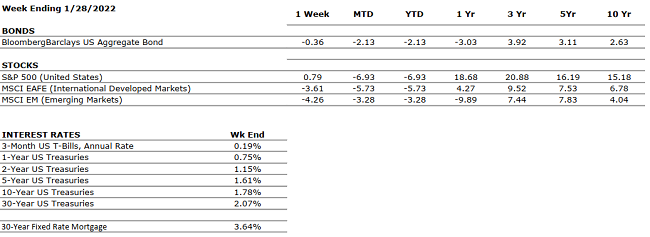
In an oddly quiet end to a volatile week in the markets where we saw a 1,000-point swing in the Dow Jones Industrial Average in one day, each major market index closed the week in positive territory or up slightly. The Dow Jones Industrial Average rose +1.3%, the S&P 500 Index gained +0.8% and the NASDAQ was unchanged. Year-to-date, the returns tell a different story as the severe volatility has impacted each major index, especially the technology-heavy NASDAQ. Year-to-date, the Dow Jones Industrial Average is down –4.4%, the S&P 500 Index is down –6.9% and the NASDAQ is down by –12.0%. Even bonds, which investors flock to in times of great volatility and fear, moved lower in price as a result, and the 10-Year U.S Treasury bond rose by three basis points to close the week at 1.78%.
As mentioned, volatility in the markets has spiked, unlike 2021 where volatility was quiet and subdued. (See the chart below of the VIX (Volatility Index) from YCharts and Valley National Financial Advisors.) The VIX, the Chicago Board of Options Exchange Index, is designed to reflect investors’ consensus view of the future expected stock market volatility.
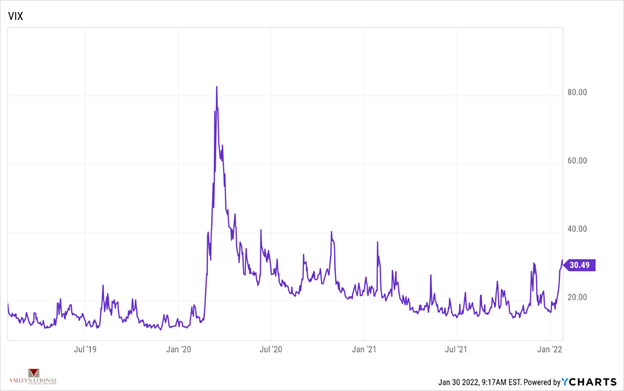
While the VIX has spiked in recent moves, it is nowhere near the fear levels we saw in March 2020 as the pandemic settled onto Wall Street. Earlier in the week, all the market noise was about the Fed and Jay Powell’s press conference following the end of the two-day FOMC (Federal Open Market Committee) meeting on Wednesday. Once the meeting was over, Chairman Powell had assuaged concerns that the Fed would be reckless in adjusting monetary policy. Further, Powell acknowledged that recent indicators of economic activity and employment continue to strengthen but remain impacted by the recent sharp rise in COVID-19 cases. Further, while Powell pointed to inflation running well above his 2% target, supply and demand imbalances related to the pandemic remain in place and are responsible for inflationary pressures. Lastly, the minutes of the FOMC meeting repeated their previous statement, “that it will continue to reduce the pace of bond purchases and expects it will be soon appropriate to raise the target range for the federal funds rate.”
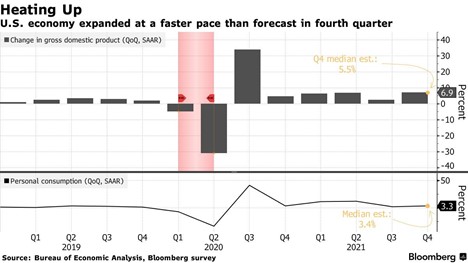
As we mentioned last week, equity markets have historically performed well through interest rate tightening cycles, and we pointed out to a Bloomberg article stating that the S&P 500 Index had averaged +9% annually during the previous 12 tightening cycles going all the way back to 1950. Our view is that while we will have greater volatility (see VIX above) we still expect markets to be positive in the year ahead. While last week focused mostly on the Fed and the release of the FOMC meeting minutes, an important economic report went almost unnoticed. U.S. 4th Quarter GDP was released at +6.9%, well above Wall Street economists’ expectations of +5.5% and full year 2021 GDP came in at +5.7%, also above consensus estimates. (See the chart below from the Bureau of Economic Analysis and Bloomberg).
The current economic expansion, which started mid-third-quarter 2020, while solidly underway, still has plenty of pent-up steam left. In fact, FactSet has corporate earnings growth topping 9% this year; and the economic expansion continuing well into 2023. Again, we agree here as we have pointed out the relative financial strength and health of the banks, corporations, and the consumer; each of which individually and jointly fuels the economy. There are a few things that we are keeping our eyes on for a potential shock to the markets including: tensions between Russia and Ukraine, continued outbreaks of new COVID-19 variants and even oil prices, which continue to grind higher, hitting $84.48/bbl. last week (see chart below from the Federal Reserve Bank of St. Louis).
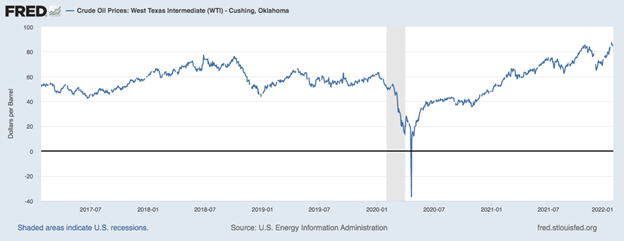
Oil prices are now higher than pre-pandemic levels when the U.S. was considered by many to be oil independent. Oil is critical for most economic activity from plastics to home heating oil to gasoline; so, increases in prices will have immediate and lasting effects on inflation.
It is easier to get swooped up with the noise of the markets and Wall Street than to stay focused on what is in front of us: economic expansion, attentive monetary policy, and a healthy and wealthy consumer.
The Numbers & “Heat Map”
THE NUMBERS
 Sources: Index Returns: Morningstar Workstation. Past performance is no guarantee of future results. Indices are unmanaged and cannot be invested into directly. Three, five and ten year returns are annualized. Interest Rates: Federal Reserve, Mortgage Bankers Association.
MARKET HEAT MAP
The health of the economy is a key driver of long-term returns in the stock market. Below, we assess the key economic conditions that we believe are of particular importance to investors.
|
US ECONOMY |
||
|
CONSUMER HEALTH |
POSITIVE |
U.S. GDP growth decelerated to a 2% annualized pace in Q3. The slowdown was driven primarily by supply chain constraints. Economists expect a modest acceleration in Q4. Early high-frequency data (shopping, travel, movie ticket sales) is showing some slowing. Holiday retails sales numbers will be important to gauge consumer behavior. |
|
CORPORATE EARNINGS |
POSITIVE |
Fourth quarter wrapped up and earnings are likely to be impacted by labor, supply shortages, price increases and wage inflation. As EPS estimates are ironed out each of these items will play a role, some greater than others. Watch for increases but at a muted pace. |
|
EMPLOYMENT |
POSITIVE |
Although December increase in payrolls did not meet expectations (199,000 jobs added versus 422,000 expected), the unemployment rate fell to 3.9% versus an expected 4.1%. Wages increased more than expected at 4.7% year-over-year. Strong recovery in leisure and hospitality which had the biggest gain by industry and accounted for more than 25% of all jobs added in December (55,000). |
|
INFLATION |
NEGATIVE |
CPI rose 7% year-over-year in December 2021, the highest increase since 1982, driven by the global supply chain backlog and continued consumer pent up demand. Will inflation be transitory or permanent? Goldman Sachs capital market assumption forecast CPI at an average of 3.1% for 2022 suggesting a significant decrease in inflation from the current 7%. |
|
FISCAL POLICY |
NEUTRAL |
The Build Back Better Bill has been scaled back from $2.2 trillion to a $1.8 trillion version as Senator Manchin continues to hold back support. President Biden has mentioned the idea of breaking up the BBB Bill into smaller pieces to be able to pass fractions of it. The economy seems to be digesting a new world where fiscal policy is no longer considered an economic stimulus. |
|
MONETARY POLICY |
NEUTRAL |
Fed discussed a triple threat of tightening: raise interest rates, halt purchases, and reduce its balance sheet (reducing holdings of Treasurys and mortgage-backed securities). Gradual and steady reduction of liquidity will be key in preserving market performance (fast and sudden changes would most likely result in panic-driven sell offs). Expect three rate hikes in 2022 beginning in March. |
|
GLOBAL CONSIDERATIONS |
||
|
GEOPOLITICAL RISKS |
NEUTRAL |
The omicron COVID-19 variant has shown up in many parts of the world. This strain seems less virulent and more reactive to boosters so its impact it still yet to be calculated. A rebound in travel and leisure now seems unsure. Important to watch the Russia/Ukraine situation. |
|
ECONOMIC RISKS |
NEUTRAL |
Supply chain disruptions are hampering the economy; however, demand remains very strong. While global logistics are operating far below normal efficacy, it appears the supply chain is slowly improving and may reach normalcy by mid-to-late-2022. |
The “Heat Map” is a subjective analysis based upon metrics that VNFA’s investment committee believes are important to financial markets and the economy. The “Heat Map” is designed for informational purposes only and is not intended for use as a basis for investment decisions.