
Join Team VNFA in celebrating Jaclyn M. Cornelius, CFP®, EA.
She is being honored among the 2022 Women of Influence. 2022 Women of Influence Honorees – LVB

Join Team VNFA in celebrating Jaclyn M. Cornelius, CFP®, EA.
She is being honored among the 2022 Women of Influence. 2022 Women of Influence Honorees – LVB
by William Henderson, Chief Investment Officer
While domestic resiliency was present last week with strong jobs and earnings numbers, volatility related to the war in Ukraine won the week over and all three major market indexes closed lower. The Dow Jones Industrial Average fell -1.3%, the S&P 500 Index also fell -1.3% and the NASDAQ fell by -2.8%. Year-to-date returns continue to be unfavorable across all sectors and indexes. Year-to-date, the Dow Jones Industrial Average is down -7.2%, the S&P 500 Index is down -8.9% and the NASDAQ is down -14.8%. As a result of the uncertainty, fear, and volatility the “risk-off” trade occurred in the bond market and the prices of U.S. Treasury bonds moved dramatically higher sending yields sharply lower. The yield on the 10-Year U.S. Treasury fell 23 basis points from last week to close the week at 1.74% – a stunning move considering the path the Fed has laid out this year for interest rates. What this move tells us is that the safety and liquidity of U.S. Treasury bonds currently trumps everything else, including the Fed’s well-telegraphed plan of raising short-term interest rates.
The move in U.S. Treasury yields further “flattened” the yield curve. If the yield curve (the measure of 10-year yields minus two-year yields) is flattening, it indicates the yield spread between long-term and short-term bonds is decreasing. The yield curve is often a reliable indicator of economic and monetary policy conditions. The recent yield curve flattening is a result of two-year Treasury bond rates rising in anticipation of Fed policy rate hikes; while 10-year rates declined, due to the flight to safety trade resulting from increased concerns over the war in Ukraine. (See the chart below from the Federal Reserve Bank of St. Louis showing the 10s – 2s spread and the dramatic decline since mid-year 2021).
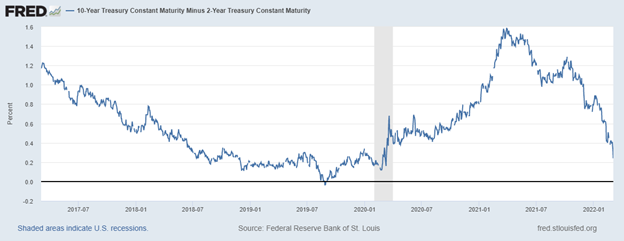
While a downward movement in the 10s – 2s spread has historically preceded an impending recession, we do not believe this to be the case now due to the sound underlying fundamentals of the U.S. economy including strong continued employment gains and near-record profits by corporations. According to FactSet, with the recent fourth quarter 2021 earnings season concluding last week, companies in the S&P 500 recorded average earnings gains of 31% over the fourth quarter of 2020. With such solid underlying economic fundamentals, why are the markets exhibiting such volatility and negative returns year-to-date? Fear and uncertainty! These are and will always be the worst thing for markets. When you cannot measure the risk, the risk-off trade prevails, and investors sell stocks and buy bonds. Additionally, the Ukraine war and resulting severe sanctions on Russia are impacting many commodity prices, further exacerbating already hot-running inflation. This reaction again may be more than necessary, while oil spikes occurring are understood as Russia is a large supplier of oil to the world, their impact on the global economy is much less than one would think. See the chart below from Haver Analytics and Goldman Sachs showing Russia’s contribution to the global economy and Russia’s production percent of important commodities.
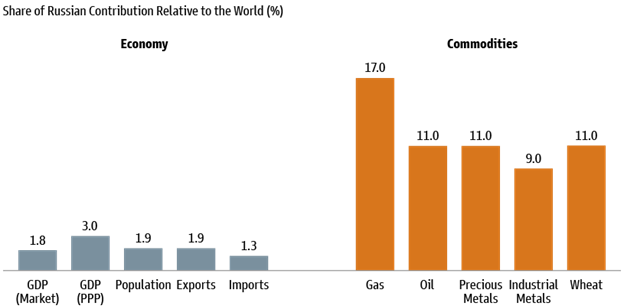
Presently, oil is the biggest shock to the market and the price of WTI Crude has spiked to $130/barrel. Oil, as we have stated many times, is a key component in many household and industrial goods way beyond refined fuels for planes, trains, and automobiles. Oil is used in clothing (nylon & polyester), plastics, agriculture (pesticides & fertilizers), tools and toys – frankly – it is everywhere and when the price of oil rises, inflation is the result. These events – global slowdown in activity due to sanctions on Russia and the resulting inflationary impacts – puts the Fed in a quandary. Fed Chairman Jay Powell must raise rates to combat inflation but now he also risks slowing the economy at a time when things are precarious as the Russia/Ukraine war evolves. And thus, we have the uncertainty that the markets hate.
Western nations are united in sanctioning Russia for starting the war with Ukraine. China, a strategic and economic partner of Russia, has not officially condemned the incursion but has stated succinctly that “all sides exercise restraint and avoid escalation.” While not a stern rebuke like the west, it may be the best we can expect from China, who selfishly understands any global economic slowdown will directly hurt their pocketbook. The obvious question is which side yields first – Russia led by Vladimir Putin, a former KGB Officer or Ukraine led by Volodymyr Zelenskyy, a former TV actor and his western “allies.” Again – uncertainty, and again – volatility in the markets. Balanced portfolios with risk management tools like bonds help in times like this. What helps best is a level head and a long-term outlook on investments.
THE NUMBERS
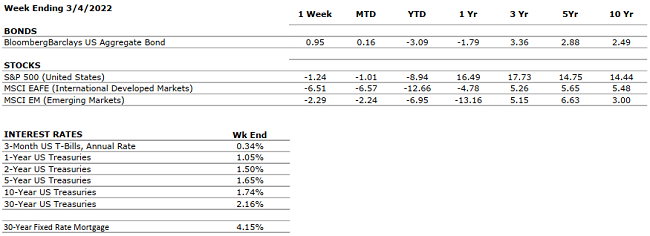 Sources: Index Returns: Morningstar Workstation. Past performance is no guarantee of future results. Indices are unmanaged and cannot be invested into directly. Three, five and ten year returns are annualized. Interest Rates: Federal Reserve, Mortgage Bankers Association.
MARKET HEAT MAP
The health of the economy is a key driver of long-term returns in the stock market. Below, we assess the key economic conditions that we believe are of particular importance to investors.
|
US ECONOMY |
||
|
CONSUMER HEALTH |
POSITIVE |
U.S. Real GDP growth for Q4 2021 increased at an annual rate of 7.0% compared to 2.3% in Q3 (according to second estimate). The acceleration was driven primarily by private inventory investment. Real GDP increased by 5.7% in 2021 versus a decrease of -3.4% in 2020. Disposable income saw a slight increase of 0.3% and personal saving rate decreased to 7.4% in Q4 from the previous 9.5% in Q3 highlighting increased consumer spending. |
|
CORPORATE EARNINGS |
POSITIVE |
Fourth quarter earnings are showing strong results with 76% of companies that reported earnings so far beating estimates by an average of 8.2%. Revenues also well above estimates with 78% of S&P 500 companies reporting actual revenue above forecasts. Blended earnings growth rate for 2021 was 30.7%. So far, 95% of S&P500 companies have reported earnings. |
|
EMPLOYMENT |
POSITIVE |
U.S. Payroll Report for January U.S. added 467,000 jobs in January, beating estimates of 125,000. Red-hot private sector hiring drives the payrolls surge. Revisions add 709,000 jobs in prior two months. Unemployment rate rises to 4% from 3.9%. |
|
INFLATION |
NEGATIVE |
CPI rose 7.5% year-over-year in January 2022, the highest increase since 1982, driven by the global supply chain backlog and continued consumer pent up demand. Inflation concerns are clearly impacting the markets, the FED and consumer behavior. |
|
FISCAL POLICY |
NEUTRAL |
President Biden is shifting from the Build Back Better Bill to a four-point economic rescue plan. Emphasis on reducing deficits and containing inflation will be critical to sway Senator Manchin. The four points will be: moving goods cheaper and faster, reducing everyday costs, promoting competition, and eliminating job barriers. |
|
MONETARY POLICY |
NEUTRAL |
Fed discussed a triple threat of tightening: raise interest rates, halt purchases, and reduce its balance sheet (reducing holdings of Treasurys and mortgage-backed securities). Gradual and steady reduction of liquidity will be key in preserving market performance (fast and sudden changes would most likely result in panic-driven sell offs). Upcoming Fed meeting on March 15- 16. |
|
GLOBAL CONSIDERATIONS |
||
|
GEOPOLITICAL RISKS |
NEGATIVE |
The Russian invasion into Ukraine has now turned into a full-blown global event. US, UK and EU authorities are taking many steps to cripple Russia including closing their access to SWIFT. Commodity prices are spiking along with Oil. COVID-19 concerns continue to abate and re- openings are more the norm than closures and lockdowns. The CDC is easing rules. |
|
ECONOMIC RISKS |
NEUTRAL |
Supply chain disruptions in the U.S. are waning but now there are trucker protests on the Canadian / U.S. border. Canada is the second largest trading partner with the U.S. (after China) but our largest export market. |
The “Heat Map” is a subjective analysis based upon metrics that VNFA’s investment committee believes are important to financial markets and the economy. The “Heat Map” is designed for informational purposes only and is not intended for use as a basis for investment decisions.
“A miracle is something that seems impossible but happens anyway.” – Michael Stuhlbarg
2021 Charity Deductions
You probably know that you can get an income tax deduction for a gift to a charity if you itemize your deductions. However, the Consolidated Appropriations Act, 2021 offers enhanced tax incentives for making charitable contributions for the 2021 tax year. READ MORE
Tune in Wednesday, 6 PM for “Your Financial Choices” with Laurie Siebert on WDIY 88.1FM. Laurie will discuss: Listener Tax Questions – Keep Them Coming!
Laurie can address questions on the air that are submitted either in advance or during the live show via yourfinancialchoices.com. Recordings of past shows are available to listen or download at both yourfinancialchoices.com and wdiy.org.
Did you know that the first Friday in March is Employee Appreciation Day? Employee Appreciation Day began in 1995, as a response to Boss’s Day, and is meant to honor employees everywhere, in all industries. We know that our employees are our company’s greatest asset and so we sent our gratitude to them for their continued contributions and dedication to Valley National Financial Advisors and our clients.