
Our offices are closed along with the markets on Monday, June 20 in observance of the Juneteenth holiday.
Daily Archives: June 14, 2022
Current Market Observations
by Jonathan Susser, Investment Technology Associate
Little seems to be changing week-to-week in terms of consumer sentiment and the markets—that is that both are hitting recent lows. Russia’s invasion of Ukraine rages on, inflation hits a multiple decade high, and COVID remains a concern in China due to city-wide quarantines and lockdowns. Despite all of these apparent headwinds, history tells us that markets, even violently turbulent ones, recovery and investors are best suited with proper planning and commitment to long-term strategies.
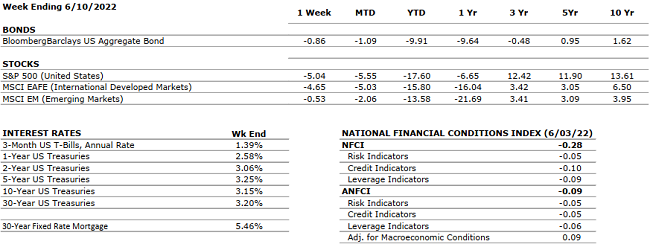
Markets (as of 6/10/22; change since 1/1/22)
| Equities (+/- %) Dow Jones: 31,392.79 (-13.61%)S&P 500: 3,900.86 (-18.16%)NASDAQ: 11,340.02 (-27.52%) | Commodities (+/- %) Gold (spot): 1,874.51 (3.37%)Oil (Brent): 119.91 (54.92%)Wheat (bushels): 1,090.50 (28.75%) |
| Interest Rates (+/- bpts.) UST-2 Yr.: 3.06 (+228 bps)UST-5 Yr.: 3.25 (+188 bps)UST-10 Yr.: 3.15 (+152 bps) | Currencies (appreciation: +%; depreciation: -%) € (EUR/USD): 1.049 (-7.74%)£ (GBP/USD): 1.227 (-9.17%)₽ (USD/RUB): 55.750 (-24.83%) |
Global Economy
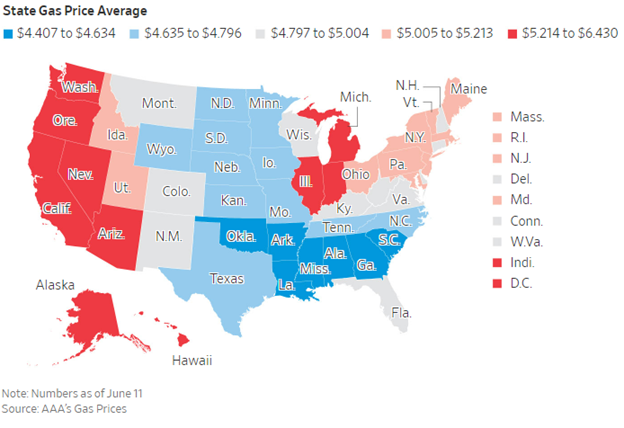
The average price of a gallon of gasoline in the USA broke the $5 per gallon threshold on Friday for the first time, contributing to high inflation across various industries, including food and other necessities. Chart 1 below illustrates the average price of gasoline on a state-by-state basis.
Chart 1: State Gas Price Average
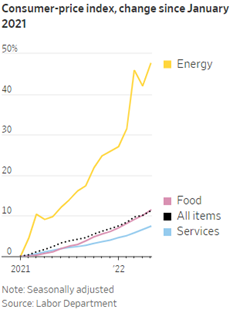
U.S. inflation numbers hit 8.6% on an annualized basis in May, making the month’s rate the highest since December 1981. Charts 2 and 3 showcase both the year-over-year CPI changes as well as CPI changes across industries from this year alone.
Chart 2: Consumer Price Index, Change from a Year Earlier
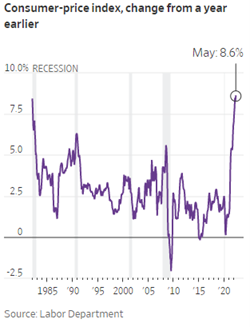
Chart 3: Consumer Price Index, Change since January 2021
Policy and Politics
The leaders of several European Union members will be meeting with President Zelensky later this week in order to discuss recent Russian gains in Ukraine. Zelensky has requested additional weapons and arms from Western countries to help combat Russia’s invasion attempt.
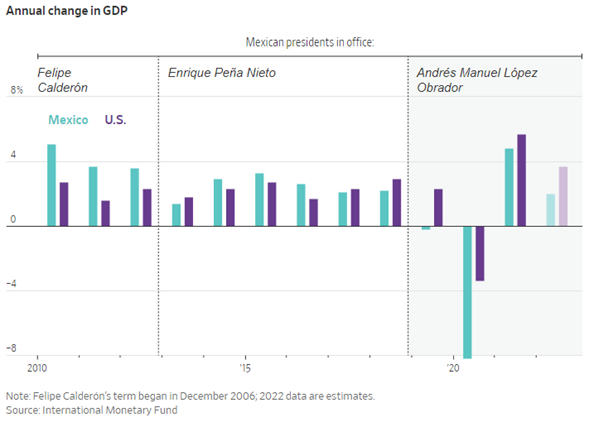
Mexican president Andrés Manuel López is attempting to nationalize several foreign-owned private companies’ energy assets, such as a fuel import terminal owned by KKR & Co and an 1,100-megawatt power plant owned by Iberdola SA. López is hoping to shift to a “Mexico-first” policy path focused on the domestic producers of natural resources. Chart 4 shows the annual change in Mexico’s GDP vs the U.S. under several presidents’ tenures.
Chart 4: Mexican GDP Growth versus the U.S.
What to Watch
- Month-over-month U.S. business inventories to be released on 6/15/22 at 10:00am EST.
- U.S. Building Permits data to be released on 6/16/22 at 8:30am EST.
- U.S. Housing Starts will be announced on 6/16/22 at 8:30am EST.
The Numbers & “Heat Map”
 THE NUMBERS
The Sources: Index Returns: Morningstar Workstation. Past performance is no guarantee of future results. Indices are unmanaged and cannot be invested into directly. Three, five and ten year returns are annualized. Interest Rates: Federal Reserve, Mortgage Bankers Association.
MARKET HEAT MAP
The health of the economy is a key driver of long-term returns in the stock market. Below, we assess the key economic conditions that we believe are of particular importance to investors.
|
US ECONOMY |
||
|
CONSUMER HEALTH |
NEUTRAL |
Q1 2022 Real GDP shrunk at a 1.5% annual rate according to the second estimate. This is the first contraction since the beginning of the pandemic. The main factors that resulted in a decrease in GDP were a surge in imports and trade deficit highlighting that the U.S. is buying more goods from foreign countries. This may be an indication that the U.S. economy has recovered faster than other countries. |
|
CORPORATE EARNINGS |
NEUTRAL |
The earnings growth rate for Q1 2022 was 9.2% — the lowest since Q4 2020 (3.8%). This estimate was revised upward from the previous forecast of 7.1% in April. All S&P500 companies have reported earnings — 77% reported a positive EPS surprise and 73% beat revenue expectations. The estimated growth rate for Q2 2022 is now 4.0% which would mark a new post-pandemic low. |
|
EMPLOYMENT |
POSITIVE |
Total nonfarm payroll employment rose by 390,000 in May and the unemployment rate remained constant at 3.6%. Job growth was widespread, led by gains in leisure and hospitality, manufacturing, and transportation and warehousing. Employment in retail trade declined. |
|
INFLATION |
NEGATIVE |
CPI rose 8.6% year-over-year in May2022, the largest increase since December 1981. Core CPI recorded a 6.0% increase (down slightly from April). The increase in CPI was driven by energy, food, and shelter. After declining in April, energy increased by 3.9% over May and gasoline rose by 4.1%.
|
|
FISCAL POLICY |
NEUTRAL |
After passing a $13.6 billion package to support Ukraine a few weeks ago, the House approved an additional $40 billion military and humanitarian package for Ukraine. The bill was passed with 368 votes against 57 votes. The total of the two packages ($53 billion) is the largest foreign aid moved through Congress in over 20 years. |
|
MONETARY POLICY |
NEUTRAL |
The Fed raised rates by the expected 25 bps in March and 50 bps in May. Jay Powell projected a clear path for 2022 with as many as five additional rate hikes. The next decisions by the Fed will be data-driven based on future inflation numbers and estimated economic growth. |
|
GLOBAL CONSIDERATIONS |
||
|
GEOPOLITICAL RISKS |
NEGATIVE |
Russia was able to avoid default so far by making the required payment on its debt however, the U.S. has imposed additional sanctions barring Russia from using U.S. banks to make debt payments. The next coupons worth $400 million will be due on June 23rd and 24th and Russia is trying to leverage resources outside the Western financial infrastructure to make these payments. |
|
ECONOMIC RISKS |
NEUTRAL |
Supply chain disruptions in the U.S. are waning but the rising cost of oil due to the Russian-Ukraine war is likely to cause additional inflationary pressures not only on gasoline prices but also on many other goods and services. Starting in June, China has started to remove some restrictions in major cities to end the COVID-19 lockdown. |
The “Heat Map” is a subjective analysis based upon metrics that VNFA’s investment committee believes are important to financial markets and the economy. The “Heat Map” is designed for informational purposes only and is not intended for use as a basis for investment decisions.
Quote of the Week
“For to be free is not merely to cast off one’s chains, but to live in a way that respects and enhances the freedom of others.” – Nelson Mandela
“Your Financial Choices”
Tune in Wednesday, 6 PM for “Your Financial Choices” with Laurie Siebert on WDIY 88.1FM. Laurie will highlight Top Takeaway from Past Shows.
Laurie can address questions on the air that are submitted either in advance or during the live show via yourfinancialchoices.com. Recordings of past shows are available to listen or download at both yourfinancialchoices.com and wdiy.org.