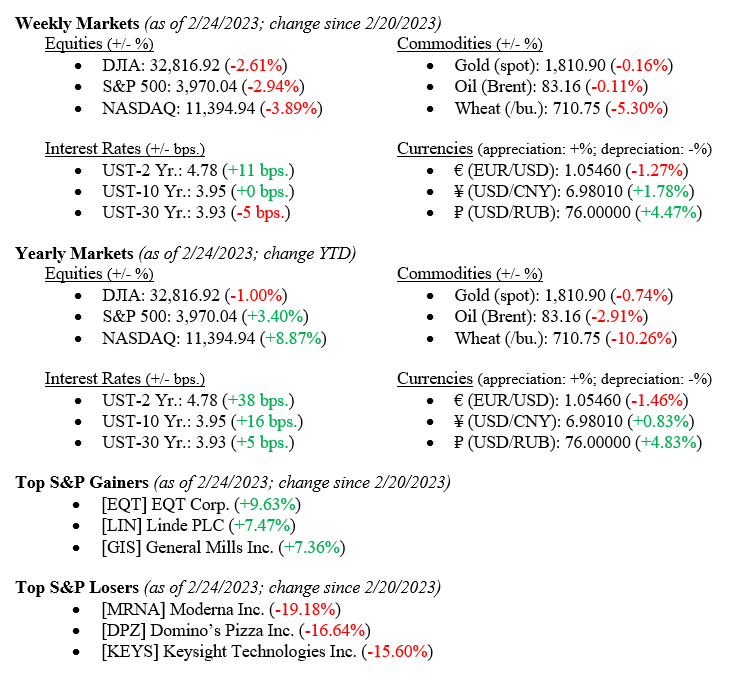
Equity markets performed poorly last week in anticipation of the release of the Federal Reserve minutes. The Dow ended lower -2.61%, the S&P down -2.94%, and the NASDAQ finished the week down -3.89%. News of an approximately 16% decrease in US Real GDP QoQ (down to 2.70% from 3.20%) and a significant increase in U.S. Core PCE MoM (up 0.60% from 0.40% previously) contributed to the weak performance of the market. Additionally, consumer debt rose to a record $16.9T, and OECD is becoming slightly more optimistic about its global outlook.

Global Economy
Consumer debt reached a record $16.9 trillion (with a T), up approximately $1.3T from the year prior. Much of this debt is held in mortgage loans, roughly $11.9T worth, despite the recent decline in originations which fell to $498 billion, less than half of 4Q21’s number and a drop of $135B from 3Q22. With this increase in debt comes an increase in delinquencies, rising to 0.57% for mortgages (more than double the year prior), 2.2% for the auto loan debt, and 4% for credit card debt. The below chart from the Federal Reserve Bank of New York shows the evolution of the Total Debt Balance over the last 20 years.
Chart 1: Total Debt Balance

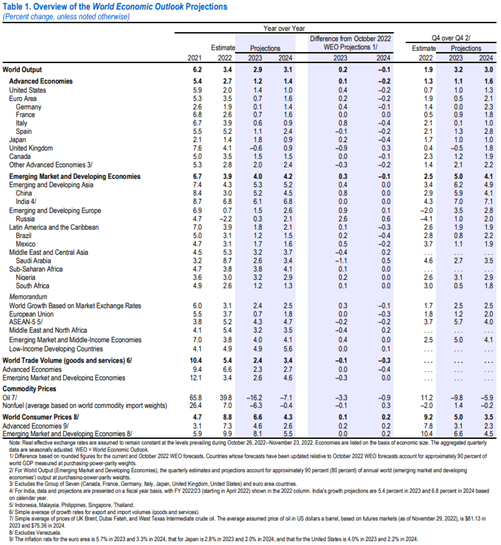
The OECD Secretary-General has mentioned a “slightly brighter” economic outlook for 2023 than previously thought while also acknowledging that inflation risks continue to remain elevated. The reasoning for this change in perspective is due to falling energy and food prices that are far below their peaks throughout the European Union. Additionally, the OECD made sure to highlight that China’s continual reopening is “overwhelmingly positive” for the global economy and its attempts at mitigating inflation. “Over the medium to longer term, this is very much a positive in terms of making sure that the supply chains function more efficiently and more effectively, making sure that demand in China and indeed trade more generally resumes in a more positive pattern,” he said during the World Economic Forum in Davos, Switzerland last month. The below chart from the IMF, published in January 2023, does a fantastic job of breaking down the global outlook by both Advanced and Developing economies.
Chart 2: Overview of World Economic Outlook Projections

What to Watch
- Monday, February 27th
- U.S. Pending Home Sales YoY at 10:00AM (Prior: -33.76%)
- U.S. Retail Gas Price at 4:30PM (Prior: $3.494/gal.)
- Tuesday, February 28th
- Case-Shiller Composite 20 Home Price Index YoY at 9:00AM (Prior: 6.78%)
- Case-Shiller Home Price Index: National at 9:00AM (Prior: 298.11)
- U.S. Crude Oil Production at 3:30PM (Prior: 371.24M bbl.)
- Wednesday, March 1st
- U.S. Recession Probability at 11:00AM (Prior: 57.13%)
- Thursday, March 2nd
- 30 Year Mortgage Rate at 12:00PM (Prior: 6.50%)
Despite recent weak performance in the markets, global outlooks are beginning to become less negative. Note this does not necessarily mean a “stronger” economy. However, recession probability is on the decline (albeit slowly), and inflation is gradually but surely tempering, with interest rate increases being pushed to quicken the pace of adjustment. As mentioned, one of our more significant concerns here at VNFA is the current level of consumer debt. With inflation at its elevated level and the end of a “free money” environment, we expect consumers to pull back on their spending. Still, the opposite seems to be occurring, and delinquencies are rising. We still believe the economy is better than many others seem to believe, but we are willing to acknowledge areas of concern that may affect our outlook as we advance.
